Mastering Microarray Data Analysis: A Step-by-Step R/Bioconductor Tutorial
March 18, 2024Installation
Install R (and RStudio)
R is available at the CRAN website. Upon choosing a CRAN mirror, you can download R.
R is available for Linux, Mac and Windows.
You can download RStudio from the RStudio website.
Install R packages
Check out this video tutorial on installing packages in R.
Part of the reason that R is so popular is the enormous diversity of packages that are available for R. Packages are collections of R programs that are able to perform a certain analysis, e.g. Matrix is a package that contains all the R-code you need for creating and working with matrices. R packages are available at the CRAN and Bioconductor websites.
| How to install packages in R ? |
|---|
| Open R or RStudio as administrator and install packages as follows: Once you start typing the name of a package, RStudio tries to autocomplete it: Select the package you want to install – in this case ggplot2 – and click the Install button. |
Issues with installation of R/R packages
Mac: error message: Setting LC_CTYPE failed, using “C” during package installation
- Close RStudio
- Open Terminal
- Type:
defaults write org.R-project.R force.LANG en_US.UTF-8
- Close Terminal
- Start RStudio and retry installation
Creating a project in RStudio
An R project is a folder in RStudio where all your work on one project (e.g. a chapter in your PhD dissertation) is gathered. Projects help you to stay organized. When you create a project R will load data and scripts from and save results to this folder.
| How to create a project ? |
|---|
| Select New Project from the Project dropdown menu in the top right corner. Next you have to specify if the project should reside in a new or in an existing directory on your computer. |
Creating and running scripts
A script is a text file that contains all the commands you will use. You cannot only write and run scripts but you can also save them so next time you need to do a similar analysis you can change and re-run the script with minimal effort. An R project can contain multiple scripts.
Commands
Scripts consist of a list of commands. Commands in R have a certain format:
output <- method(list of arguments)
Alternatively, you may use the following format:
output = method(list of arguments)
For example:
p = ggplot(mtcars,(aes(wt,mpg))
In this example ggplot() is the method. It generates a plot so the plot p is the output of the method. Before a function can start the actions and calculations that it encodes, it needs prior information: input data and parameter settings. These are called the arguments of the function. In this example the arguments are:
mtcars: a data frame consisting of 9 columns containing the input data
aes(wt,mpg): defines the columns you want to plot (wt and mpg) and how you want to plot them (wt on the X- axis and mpg on the Y-axis)
Creating a new script
| How to create a new script in RStudio ? |
|---|
| Click File in the top menu: New File > R Script |
Loading packages in R
You only need to install a package once. But each time you want to use a package you have to load it (activate its functions).
| How to load packages in R ? |
|---|
Loading a package is done by typing the following command directly in the console or as part of a script:# load packages library("packagename") |
Getting help / documentation in R
You can find a lot of documentation online:
- The documentation section of the R website
Unfortunately this section is nor easily accessible nor well-structured and it can be quite a challenge to consult the help files of different R packages and functions online. By far the most user-friendly interface for searching the R documentation is the Rdocumentation website. - Documentation of RStudio
- Quick R: for those who would like to make the transition to R (from SAS, SPSS, Stata)
- R-bloggers: R-news and tutorials contributed by bloggers
- Inside-R: a website created by people who are using R containing examples, how-to’s, packages…
Some R commands allow you to consult the documentation:
| How to show the documentation of a package ? |
|---|
You can ask R to open a browser with a documentation file for a complete package:help(package=”packagename”) |
You can also ask for information on specific topics, e.g. find out what arguments a method needs…
| How to show the documentation of specific topics ? |
|---|
You can ask for documentation of individual classes:help(topicname) Try some examples to see what help() does: help(help) help(matrix) help(print) Alternatively you can use: ? topicname |
Data types in R
| How to check which data type a variable belongs to ? |
|---|
To know which class an object belongs to:class(objectname) |
A data frame contains several elements. It essentially has a matrix structure but some of the columns of the data frame might be matrices themselves. The different elements are allowed to contain different data types.
| How to list the elements of a data frame ? |
|---|
To find out which elements are available for a data frame, use the following command:names(dataframename) |
All columns in a matrix must have the same data type and length.
| How to list the names of the rows or columns of a matrix ? |
|---|
To find out which elements are available for a data frame, use the following command:rownames(matrixname) columnnames(matrixname) |
Install the required R packages
To analyze microarray data, you need a specific R package, called Bioconductor.
However, Bioconductor uses functions and object from various other R packages, so you need to install these R packages too:
- Matrix
- lattice
- fdrtool
- rpart
So Bioconductor will only work after you have installed these packages.
Additionally, you will need an R-package for making graphs of the data, called ggplot2
Install Bioconductor packages from Bioconductor repository
You need the following Bioconductor packages for Affymetrix array analysis:
- affy, affyPLM and simpleaffy if you want with older arrays (3′ arrays)
- oligo if you work with newer arrays (HTA, Gene ST…)
It is important to realize that it is best to pick one of these two choices. If you load multiple packages with similar functionality, e.g. both affy and oligo or both simpleaffy and oligo, R will become confused. The affy-based packages and oligo contain methods with the same name (e.g. intensity(), MAplot(), rma()) but with slightly different code. So R will not know if it has to use the intensity() method from the affy packages or from oligo. By default it chooses affy over oligo. So you always have to specify the packagename for the oligo methods
- affydata if you need example data sets
- ArrayExpress if you want to obtain data from ArrayExpress
- limma
- Biobase
- Biostrings
- genefilter
- Bioconductor packages for the annotation of the spots on the arrays
How to install Bioconductor packages in R
| How to install BioConductor packages in R ? |
|---|
To install Bioconductor packages type the following commands in R:source("http://www.bioconductor.org/biocLite.R") biocLite(“packagename”) |
To install the annotation packages for the arrays that you used in your experiment, go to the list of annotation packages generated by Affymetrix.
In this list you can find the name of the cdf file that corresponds to the array that you have used (in our example we used ATH1 arrays so the cdf file is called ath1121501cdf).

| How to install Affymetrix annotation packages in R ? |
|---|
| You can install the ath1121501cdf package as any other BioConductor package using the biocLite() method. |
To install custom annotation packages (not from Affymetrix), go to BrainArray’s list of custom annotation packages.
| How to install custom annotation packages in R ? |
|---|
To use these cdf files, download the zip file from the website and install from the local zip file: |
Installing Bioconductor packages from source
Some Bioconductor packages will not install by running the biocLite() command. In that case you can always install them from source. In this case you go to the Bioconductor page of the package you wish to instal, as an example we take the Biostrings package (allthough it installs fine using the biocLite() command.
| How to install this package from source ? |
|---|
|

Updating installed Bioconductor packages
After some time, Bioconductor packages might become outdated. Bioconductor packages are updated fairly regularly.
| How to update BioConductor packages in R ? |
|---|
To identify packages that can be updated within your version of Bioconductor, start a new session of R and enter the following commands:source("http://www.bioconductor.org/biocLite.R") biocLite() |
Loading packages in R
Before you can do any programming in RStudio, you need to create a new project and a new script.
To use the installed R and BioConductor packages in R, you have to load them first.
Using a method from a specific package
If you have loaded multiple packages with similar functionality, e.g. both affy and oligo or both affyPLM and oligo, R might become confused. Affy or affyPLM and oligo contain methods with the same name e.g. intensity(), MAplot(), rma()… but with slightly different code. If you now simply use the command
intensity(data)
R will not know if it has to use the intensity() method from affy or from oligo. By default it chooses affy over oligo. To tackle this problem you have to specify the packagename in front of the name of the method for oligo, e.g.
oligo::intensity(data)
and R will know that it has to use the intensity() method of the oligo package.
Getting help / documentation in R
Bioconductor is object-oriented R. It means that a package consists of classes. The classes define the behaviour and characteristics of a set of similar objects that belong to the class. The characteristics that objects of a class can have are called slots while the behaviour of the objects (the actions they can do) is described by the methods of a class.
For instance, there is a class AffyBatch, consisting of containers that hold microarray data in a structured way. You can create an AffyBatch object to hold your data. AffyBatches have many slots, one for the intensities, one for the sample annotation, one for the probe set annotation… There are numerous methods that operate on AffyBatches: you can retrieve perfect match intensities, you can create a boxplot, you can normalize the data…
| How to show the documentation of a class ? |
|---|
You can ask for documentation of classes:help(classname) |
The documentation of a class shows:
- a short description of the class
- how to create objects of the class
- a list of slots of the class
- a list of methods that can operate on objects of the class
- some examples
| How to check which slots are available for an object ? |
|---|
To find out which slots are available for a object, use the following command:slotNames(objectname) |
Open the CEL-files in R
If you use Affymetrix chips your microarray data will consist of a series of CEL files containing raw intensities for each probe on the array. Save all CEL files you want to analyze in a single directory. They may be gzipped (*.gz) – you do not need to gunzip them.
Open CEL files from 3′ Affymetrix Arrays (older ones) using affy
Data from older Affymetrix arrays should be analysed using the affy package.
| How to open CEL files using affy ? |
|---|
You have to tell R where your CEL files are stored. R cannot find them by itself. So you have to give R the path on your computer of the folder that contains the CEL files.# specify the path on your computer where the folder that contains the CEL-files is located celpath = "D:/R-2.15.2/library/affydata/celfiles/Apum/" Then you can import all the CEL files by a single command using the ReadAffy() method. ReadAffy will read all CEL files in the folder and load them into an AffyBatch object in R. You use the celfile.path argument to specify the location of the folder that contains the CEL files. # import CEL files containing raw probe-level data into an R AffyBatch object data = ReadAffy(celfile.path=celpath) So data is now an AffyBatch object containing the data from your CEL files. |
If you are using a custom cdf file you need an additional line of code telling R that you are not using the standard Affymetrix cdf but a custom one.
| How to use a custom cdf file from BrainArray ? |
|---|
| If you want to use a custom cdf from the BrainArray website you have to indicate to R you want to use the custom cdf before you run the ReadAffy method. To this end, AffyBatches have a slot called cdfName in which the name of the cdf file that is to be used for the analysis is stored. If you want to use a custom cdf you have to store its name in the cdfName slot of your AffyBatch object. Slots can be accessed using the “@” sign. So you can access a slot by using object@ followed by the name of the slot. # indicate you want to use the custom cdf # If you don't specify the cdfname, BioConductor will use the default Affymetrix cdf. data@cdfName="ATH1121501_At_TAIRT" You can find the name of the custom cdf by going to the package folder:  Open the DESCRIPTION file and look in the Description line:  |
Open CEL files from newer Affymetrix Arrays (HTA, Gene ST…) using oligo
For these arrays the old affy package doesn’t work – instead you’ll have to use the oligo package
| How to open CEL files using oligo ? |
|---|
You have to tell R where your CEL files are stored. R cannot find them by itself. So you have to give R the path on your computer of the folder that contains the CEL files.# specify the path on your computer where the folder that contains the CEL-files is located celpath = "D:/R-2.15.2/library/affydata/celfiles/HTA/" The list.files() command should be used to obtain the list of CEL files in the folder that was specified by the celpath. You should therefore make sure that this folder only contains the CEL files you want to analyze. Then you can import all the CEL files by a single command using the read.celfiles() method. The oligo package does not save the data in an AffyBatch (as affy does) but uses different containers depending on the type of arrays used, e.g. HTAFeatureSet for HTA arrays, ExonFeatureSet for Exon ST arrays… This approach allows oligo to behave differently depending on the type of array. # import CEL files containing raw probe-level data into an R AffyBatch object list = list.files(celpath,full.names=TRUE) data = read.celfiles(list) So data is now a specific FeatureSet object containing the data from your CEL files. |
Looking at the data
- To view the full content of a simple object (vector, list, matrix or data frame): type the name of the object in the console.
- To view specific items of a simple object: refer to their location using [ ] e.g.
object[1,2] will retrieve the item on the first row and second column
object[1:2,] will retrieve all columns of the first two rows - To view an entire column of a data frame: use $ e.g. dataframe$columnname
- To access slots of complex objects: use object@ followed by the name of the slot.
How to retrieve intensities using affy
Although AffyBatches have a slot assayData to hold the raw intensities, this slot is never directly accessed. Instead two methods give access to the raw intensities in an AffyBatch: exprs() and intensity(). These methods extract the intensities of all probes (both PM and MM probes) from the AffyBatch.
| How to retrieve intensities of specific rows in the CEL files ? |
|---|
There are two methods exprs() and intensity() that can obtain intensity data. Both methods return the same result: a matrix with intensities of all probes.expr = exprs(data) int = intensity(data) They contain intensities of all probes so we will limit ourselves to looking at the first five rows of the resulting matrices as specified by 1:5 (the colon denotes a range in R) expr[1:5,] int[1:5,] As you can see both methods return the same results:  |
Since we will only work with PM probes, you might want to look at the intensities of the PM probes only using the pm() method.
| How to retrieve intensities of PM probes of specific rows in the CEL files ? |
|---|
To retrieve a matrix with PM probe intensities use the pm() method, e.g. the command below will retrieve the PM intensities of the first 5 rows of the data set.pm(data)[1:5,] Warning: To avoid confusion pm() returns probe numbers (column at the left). These probe numbers refer to the original order of the probes.  You can use this probe number to check if exprs() and pm() return the same values. exprs[217334,] pm(data)[5,]  Now the results of the pm() and the exprs() method do correspond. Warning: The first column of pm(data) contains probe numbers not probe set IDs ! |
It is of course much more useful to retrieve intensities based on probe set ID then on location in the CEL file. Often you’ll want to retrieve the data of all the probes in the probe set that represents your favourite gene.
| How to retrieve intensities of the PM probes of a specific probe set ? |
|---|
You can ask for the intensity of all PM probes of a probe set using the probe set ID, e.g. for probe set ID 245027_at:pm(data,"245027_at")  You see that there are 11 probes in this probe set and that the 7th and the last probe have much higher signals that the others. |
To plot the intensities of all the probes of a probe set, we will use ggplot(). It’s not the easiest way to go but ggplot() generates the nicest plots. To use ggplot() data has to be in the correct format (a data frame with informative column names) and categorical variables need to be transformed into factors.
| How to plot the intensities of the PM probes of a specific probe set ? |
|---|
First of all you need to get the data in the correct format: the variables you want to plot on each axis have to be in different columns. You want to plot the intensities (Y-axis) of each probe (probe ID on the X-axis) of a probe set. So you need a matrix with probe IDs in the first column and intensities in the second column. In other words you need all 6 columns of pm(data,”245027_at”) concatenated into a single column: This means that you have to repeat the IDs of the probes in the probe set also 6 times. For this we can use the rep() command. The first argument is what you want to repeat (rownames(pm(data,”245027_at”))), the second is how many times you want to repeat it (6). In this way we will create the vector (column) containing the probe IDs. probeNrs = rep(rownames(pm(data,"245027_at")),6) There are 6 samples in our experiment. So you need to adjust this number to the number of samples you have in your experiment. Then, we create the vector (column) containing the intensities of the probes of the probe set. To create a vector you can use the c() command. ints=c(pm(data,"245027_at")[,1],pm(data,"245027_at")[,2],pm(data,"245027_at") [,3],pm(data,"245027_at")[,4],pm(data,"245027_at")[,5],pm(data,"245027_at")[,6]) Now we will combine the vector with the probe IDs and the vector with the intensities into a data frame (= matrix in which columns contain data of different types: numbers, text, boolean…). The data frame contains two columns: one is called probeNrs and one is called ints. pset = data.frame(probeNrs=probeNrs,ints=ints) Since probe ID is a categorical variable (it can take only a limited number of different values) you have to transform it into a factor so that R knows that they are categorical and will treat them likewise. Transform probe IDs into factors pset$PNs = factor(pset$probeNrs,levels=pset$probeNrs) Now the data is in the correct format for ggplot. The first argument is the data you want to plot, the second defines the X- and the Y-axis. In the second line of code you define the symbol you want to use on the plot (geom_point()) and the titles of the X- and Y-axis. scatter = ggplot(pset,aes(PNs,ints)) scatter + geom_point() + labs(x="Probe Number",y="Intensity of PM probe") We now have a plot of the intensities of all the probes of a probe set over all arrays. |

| How to plot the intensities of the PM probes of a specific probe set, coloring them according to the group the sample belongs to (wild type or mutant) ? |
|---|
We want to plot the intensities in wt in blue and the intensities in the mutant samples in red. It means that we need an extra column in our data frame that defines which intensities come from wt samples (wt) and which intensities come from mutant samples (mut). The first three samples are wt and the last three samples are mutants:arrays = c(rep("wt",33),rep("mut",33)) We add this vector as a column called arrays to the data frame pset$arrays = arraysWe can now colour the symbols according to their value in the arrays column by adding the argument colour = arrays to the ggplot() command. To create a legend for the colouring you have to add the same argument to the labs() command. scatter = ggplot(pset,aes(PNs,ints,colour=arrays)) scatter + geom_point() + labs(x="Probe Number",y="Intensity of PM probe",colour=arrays) |
Retrieving annotation
Retrieving sample annotation using affy
Apart from the expression data itself, microarray data sets need to include information about the samples that were hybridized to the arrays, e.g. sample labels. AffyBatch objects have several slots (characteristics). One of them is called phenoData. It contains labels for the samples. Despite the name, there is no implication that the labels should be phenotypic, in fact they often indicate genotypes such as wild-type or knockout. They can also contain other types of information about the samples e.g. which samples are replicates, which samples were scanned by the same scanner, the amount of RNA that was hybridized to the arrays…
However, for most data sets the phenoData has not been defined.
| How to retrieve the sample annotation of the data ? |
|---|
ph = data@phenoData
ph
As you can see, ph is a data frame. Remember that you can select a column of a data frame using the $ sign. You find the names of the columns in varLabels: there is one column named sample ph$sample To look at all the data in the data frame ask for the data slot. ph@dataAnother way of looking at the sample annotation is using the pData() method on the AffyBatch object: pData(data) |
If phenoData contains no information: CEL-files are given an index 1-n (n = total number of files). You can give the samples more accurate names so these can be used in the plots that we are going to create later on. We will see how to do this when we create the plots.
When you import CEL-files from GEO or ArrayExpress the phenoData should normally already contain informative names but many submitters skip this step so many data sets are not well annotated.
Retrieving probe annotation using affy
Microarray data sets should include information on the probes. AffyBatches have a slot called featureData, a data frame that contains labels for the probes. For most data sets (also public data coming from GEO or ArrayExpress) the featureData has not been defined.
| How to retrieve the probe annotation of the data ? |
|---|
feat = data@featureData feat feat@data |
Retrieving experiment annotation using affy
Microarray data sets should also include information on the experiment. AffyBatches have a slot for this called experimentData. For most data sets (also public data coming from GEO or ArrayExpress) the featureData has not been defined.
| How to retrieve the experiment annotation ? |
|---|
exp = data@experimentData exp |
Retrieving annotation using oligo
All commands described above also work for the oligo package.
Retrieving other types of information
| How to retrieve the name of the CDF file associated with the arrays ? |
|---|
Use the cfdName() method on the AffyBatchcdfName(data) |
| How to retrieve the IDs of the probe sets that are represented on the arrays ? |
|---|
Use the featureNames() method on the AffyBatchfeatureNames(data) |
| How to retrieve the number of probe sets represented on the arrays ? |
|---|
Use the length() method to count the number of items in a vectorlength(featureNames(data)) |
| How to retrieve the number of probes represented on the arrays ? |
|---|
Use the length() method to count the number of items in the vector containing names of all probeslength(probeNames(data)) |
On Affymetrix arrays you should see an average of 10-20 probes per gene.
Quality control of microarray data
Giving the samples informative names
The code in this section works for both affy and oligo
If the phenoData object, that was created in the step where we retrieved the sample annotation, does not contain any information, Bioconductor will just give the CEL-files an index 1-6. However, the phenoData will be used as labels in plots. Give the samples more accurate names so they can be used in the plots that we are going to create.
| How to add annotation to phenoData ? |
|---|
We define that the first column of the data slot in the phenoData corresponds to the vector containing the sample names created by the c() command:ph@data[ ,1] = c("wt1","wt2","wt3","mut1","mut2","mut3") ph This is an example where we have a data set consisting of two groups of 3 replicates, 3 wild type controls and 3 mutants. If you have 3 groups of 3 replicates: ph@data[ ,1] = c("control1","control2","control3","iso1","iso2","iso3","swim1","swim2","swim3") ph@data This is an example where we have a data set consisting of three groups of 3 replicates, 3 control mice, 3 mice that were treated with a drug and 3 mice were treated by performing physical exercises |
You have to adjust this code according the number of groups and the number of replicates you have and change the sample names to names that are relevant for you. The order of the samples in the AffyBatch is determined by the CEL-file name of the sample (the CEL files are alphabetically ordered).
Create plots to assess the quality of the data
Instead of printing these plots in RStudio or the R editor, we will save the plots to our hard drive.
How to create microarray pictures
The code on this page works for both affy and oligo
| How to print the raw intensities of each array ? |
|---|
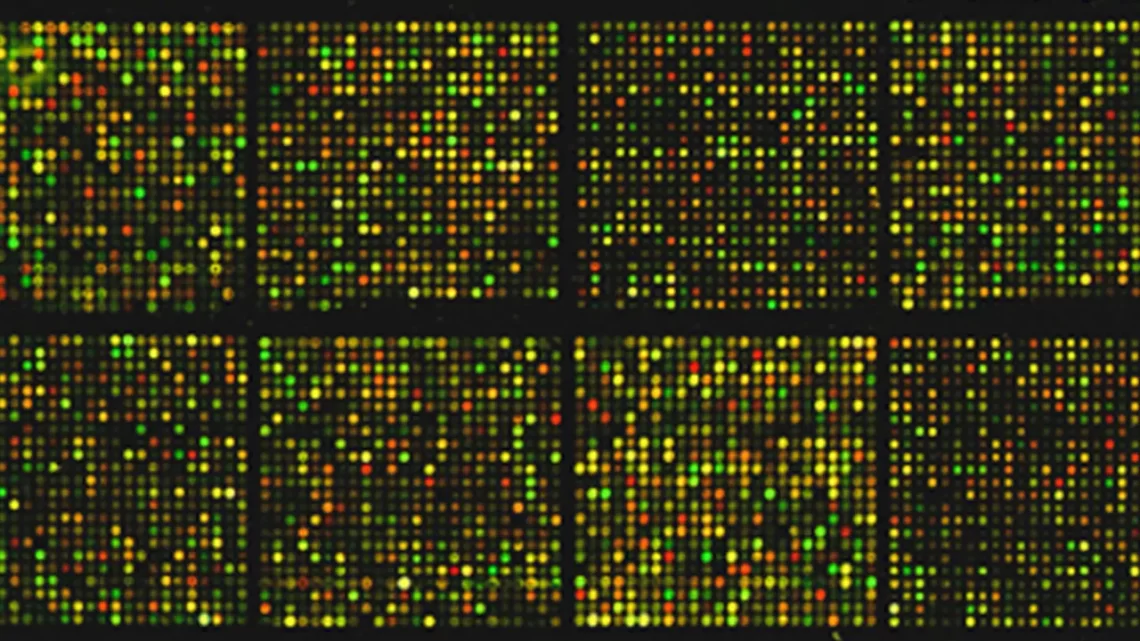
For each array we will generate a figure containing the image of that array. You see that thesample names that you specified in the phenoData are indeed used as labels in the figurefor (i in 1:6) { name = paste("image",i,".jpg",sep="") jpeg(name) image(data[,i],main=ph@data$sample[i]) dev.off() } This code was used to analyze an experiment containing 6 arrays. If you have a different number of samples you have to adjust the numbers in the code, e.g. if you have 8 arrays: for (i in 1:8) { name = paste("image",i,".jpg",sep="") jpeg(name) image(data[,i],main=ph@data$sample[i]) dev.off() } |
The figure below shows all microarray images on the same figure. This works for small arrays but gives problems for human arrays since they are so big that it’s hard to fit them on a single figure. That’s why the code above generates a separate figure for each array.
How to create chip pseudo-images
Chip pseudo images in affy
Chip pseudo-images are very useful for detecting spatial differences (artifacts) on the invidual arrays (so not for comparing between arrays).
Pseudo-images are generated by fitting a probe-level model (PLM) to the data that assumes that all probes of a probe set behave the same in the different samples: probes that bind well to their target should do so on all arrays, probes that bind with low affinity should do so on all arrays…
You can create pseudo-images based on the residuals or the weights that result from a comparison of the model (the ideal data, without any noise) to the actual data. These weights or residuals may be graphically displayed using the image() function in Bioconductor.
The model consists of a probe level (assuming that each probe should behave the same on all arrays) and an array level (taking into account that a gene can have different expression levels in different samples) parameter.
| How to fit a probe-level model to the data ? |
|---|
The Bioconductor method for fitting probe-level models is fitPLM(). As input it takes an AffyBatch object and outputs a PLMset object. It fits a probe level model to the probe intensities. The weights and residuals obtained by comparing the model with the observed data are stored in a PLMset object.Pset = fitPLM(data) The model that is used by default is the one that was described . You can use other models if you want. More info in the documentation: ? fitPLM |
The method to compute the model is quite intensive, requiring a lot of resources. If you have a large data set, you might receive an out-of-memory error when fitting the model.
| How to fit a probe-level model when you have a large number of arrays ? |
|---|
If you have a large data set, you can ask the fitPLM() to skip some calculations that you’re not going to use in your plots anyway by setting the varcov parameter to none. This will speed up the calculations and avoid out-of-memory errors.Pset = fitPLM(data,output.param=list(varcov="none")) |
Based on weights
Weights represent how much the original data contribute to the model: outliers are strongly downweighted because they are so different from the ideal data. Weights have values between 0 and 1. So the smaller the weight of a probe
-> the more the probe is not showing the typical behavior that it shows on the other arrays
-> the more its intensity can be considered an outlier
| How to create a pseudo-image based on weights ? |
|---|
For each of the 6 arrays we generate a figure containing the pseudoimage. The image() method generates by default a pseudo-image based upon the weights. The which argument specifies which array is drawn. If which is not defined, then pseudo-images of all the arrays are drawn, one by one in succession.for (i in 1:6) { name = paste("pseudoimage",i,".jpg",sep="") jpeg(name) image(Pset,which=i,main=ph@data$sample[i]) dev.off() } Again, this code was used to analyze an experiment containing 6 arrays. If you have a different number of samples you have to adjust the numbers in the code, e.g. if you have 8 arrays: for (i in 1:8) { name = paste("pseudoimage",i,".jpg",sep="") jpeg(name) image(Pset,which=i,main=ph@data$sample[i]) dev.off() } |
In the figure below, all pseudoimages were plotted on a single figure. Again, this only works for small arrays like the ATH arrays.

Small weights (outliers) are indicated in green on the figure.
If you have small arrays and you want to plot all pseudoimages on a single figure, use the following code:
op = par(mfrow = c(2,3))
for (i in 1:6){image(Pset,which=i,main=ph@data$sample[i])}
Based on residuals
Residuals are the second quantity used for chip pseudo-images. They represent the difference between the original data and the ideal data according to the model. So the more a residual deviates from 0, the larger the difference between the data and the model. Residuals can be
- positive: the intensity of the probe is larger than the ideal value according to the model
- negative: the intensity of the probe is smaller than the ideal value according to the model
| How to create a pseudo-image based on residuals ? |
|---|
Since residuals can be positive or negative, you can create four different images of residuals: based on residuals, positive residuals, negative residuals or sign of residuals.for (i in 1:6) { name = paste("pseudoimage",i,".jpg",sep="") jpeg(name) image(Pset,which=i,type="resids",main=ph@data$sample[i]) dev.off() } The type argument is used to control which of these images is drawn:
This code was used to analyze an experiment containing 6 arrays. If you have a different number of samples you have to adjust the numbers in the code, e.g. if you have 8 arrays for (i in 1:8) { name = paste("pseudoimage",i,".jpg",sep="") jpeg(name) image(Pset,which=i,type="resids",main=ph@data$sample[i]) dev.off() } |
If you have small arrays, you might fit all six pseudoimages on one plot as shown below:
op = par(mfrow = c(2,3))
for (i in 1:6){image(Pset,which=i,type='resids',main=ph@data$sample[i])}

Positive residuals are plotted in red, negative residuals in blue.
Chip pseudo images in oligo
The fitPLM() method is a medthod from the affyPLM package and does not work on FeatureSets so in oligo we need to use the alternative fitProbeLevelModel() method. This method fits robust probe level linear models to all the probe sets in an FeatureSet.
Pset = fitProbeLevelModel(data)
Creating pseudoimages based on weights is done exactly the same as in affy.
Creating pseudoimages based on residuals is slightly different from affy:
for (i in 1:6)
{
name = paste("pseudoimage",i,".jpg",sep="")
jpeg(name)
image(Pset,which=i,type="residuals",main=ph@data$sample[i])
dev.off()
}
How to create histograms of microarray data
The code on this page works for both affy and oligo
| How to plot the histograms of each array ? |
|---|
Histograms are created via the hist() method which can be applied directly on an AffyBatch/FeatureSet object.for (i in 1:6) { name = paste("histogram",i,".jpg",sep="") jpeg(name) hist(data[,i],lwd=2,which='pm',ylab='Density',xlab='Log2 intensities',main=ph@data$sample[i]) dev.off() } The which argument allows you to specify if you want to use:
Since the use of MM probes is highly controversial, we will work with perfect match probes only. The lwd argument defines the line width, xlab and ylab define the titles of the axes and main defines the title of the histogram. |
You might want to fit all histograms on the same figure:

The code for this is as follows:
op = par(mfrow = c(2,3))
for(i in 1:6){hist(data[,i],lwd=2,which='pm',ylab='Density',xlab='Log2 intensities',main=ph@data$sample[i])}
You can further play with the appearance of the plot.
| How to create one plot containing the histograms of all samples, wt and mutant replicates in a different color ? |
|---|
You are going to crate one histogram. You can put each replicate in a different color using the col argument:color=c('green','green','green','red','red','red') hist(data[,1:6],lwd=2,which='pm',col=color,ylab='Density',xlab='Log2 intensities',main='Histogram of raw data') |

Although the hist() method is very useful and easy to use, you might want to generate the histogram with ggplot(), since this gives you more freedom to make more changes to the plot. Check out the ggplot documentation.
| How to create a plot containing the histograms of all samples (each sample in a different color) using ggplot ? |
|---|
First we need to get the data in the correct format for ggplot: a data frame with log intensities in one column and sample names in the second column. We’ll only use the PM intensities pmexp = pm(data) We create two empty vectors that will serve as the two columns of the data frame:
The initialization of these vectors is essential. If you run into problems when creating these vectors and you have to repeat the plotting, always reinitialize these vectors (recreate them so that they are empty) The dim() method returns the number of rows (probes) and columns (samples) of the matrix containing the PM intensities. The number of rows corresponds to the number of PM intensities (probes) that is available for each sample (in this example that’s 251078). The sampleNames vector needs the same number of rows consisting of sample names. The logs vector will contain the log PM intensities of all six samples stacked into a single column. Up to this point we have extracted raw PM intensities, they are not yet log-transformed! You can do the log transformation using the log2() method. sampleNames = vector() logs = vector() for (i in 1:6) { sampleNames = c(sampleNames,rep(ph@data[i,1],dim(pmexp)[1])) logs = c(logs,log2(pmexp[,i])) } If you have 3 groups of 3 replicates, the code is as follows: sampleNames = vector() logs = vector() for (i in 1:9) { sampleNames = c(sampleNames,rep(ph@data[i,1],dim(pmexp)[1])) logs = c(logs,log2(pmexp[,i])) } After we have filled the vectors with the data we need, we combine sample names and log intensities into a single data frame: logData = data.frame(logInt=logs,sampleName=sampleNames) Now we can create the plot: dataHist2 = ggplot(logData, aes(logInt, colour = sampleName)) dataHist2 + geom_density() |
Box plots
Boxplots and histograms show the same differences in probe intensity behavior between arrays. In order to perform meaningful statistical analysis and inferences from the data, you need to ensure that all the samples are comparable. To examine and compare the overall distribution of log transformed PM intensities between the samples you can use a histogram but you will get a clearer view with a box plot. Box plots show:
- the median: center value, half of the intensities are lower than this value, half of the intensities are higher (= line in the box)
- the upper quartile: a quarter of the values are higher than this quartile (= upper border of the box)
- the lower quartile: a quarter of the values are lower than this quartile (= lower border of the box)
- the range: minimum and maximum value (= borders of the whiskers)
- individual extreme values (= points outside the whiskers)
The code on this page works for both affy and oligo
| How to plot the box plots of the raw data of each array ? |
|---|
Box plots are created via the boxplot() method which can be applied directly on an AffyBatch/FeatureSet object.name = "boxplot.jpg" jpeg(name) boxplot(data,which='pm',col='red',names=ph@data$sample) dev.off() The which argument allows you to specify if you want to use:
Since the use of MM probes is highly controversial, we will work with PM probes only. |

Box plots allow you to assess if the scale and distribution of the data on different arrays is comparable. Differences in shape or center of the boxes indicate that normalization of the data is required.
You can also create box plots using ggplot.
| How to create the box plot of the raw data using ggplot ? |
|---|
| First we need to get the data in the correct format for ggplot: a data frame with log intensities in one column and sample names in the second column. We’ll only use the PM intensities pmexp = pm(data) We create two empty vectors that will serve as the two columns of the data frame:
The initialization of these vectors is essential. If you run into problems when creating these vectors and you have to repeat the plotting, always reinitialize these vectors (recreate them so that they are empty) The dim() method returns the number of rows (probes) and columns (samples) of the matrix containing the PM intensities. The number of rows corresponds to the number of PM intensities (probes) that is available for each sample (in this example that’s 251078). The sampleNames vector needs the same number of rows consisting of sample names. The logs vector will contain the log PM intensities of all six samples stacked into a single column. Up to this point we have extracted raw PM intensities, they are not yet log-transformed! You can do the log transformation using the log2() method. sampleNames = vector() logs = vector() for (i in 1:6) { sampleNames = c(sampleNames,rep(ph@data[i,1],dim(pmexp)[1])) logs = c(logs,log2(pmexp[,i])) } If you have 3 groups of 3 replicates, the code is as follows: sampleNames = vector() logs = vector() for (i in 1:9) { sampleNames = c(sampleNames,rep(ph@data[i,1],dim(pmexp)[1])) logs = c(logs,log2(pmexp[,i])) } After we have filled the vectors with the data we need, we combine sample names and log intensities into a single data frame: logData = data.frame(logInt=logs,sampleName=sampleNames) Now we can create the plot: dataBox = ggplot(logData,aes(sampleName,logInt)) dataBox + geom_boxplot() |

| How to create a boxplot of normalized intensities ? |
|---|
It’s the same code as for raw intensities but this you use the normalized intensities as input (data.matrix) instead of the raw data:name = "boxplotnorm.jpg" jpeg(name) boxplot(data.matrix,col='red',names=ph@data$sample) dev.off() |
| How to create a box plot of normalized intensities using ggplot ? |
|---|
First we need to get the data in the correct format for ggplot: a data frame with normalized log intensities in one column and sample names in the second column. We create two vectors:
The dim() method returns the number of rows (probe sets) and columns (samples) of the matrix containing the normalized intensities. The number of rows corresponds to the number of normalized intensities (probe sets) in each sample (in this example it’s 22810). The sampleNames vector needs the same number of entries of each sample name stacked into a single column. The normlogs vector will contain the normalized intensities of all six samples stacked into a single column. sampleNames = vector() normlogs = vector() for (i in 1:6) { sampleNames = c(sampleNames,rep(ph@data[i,1],dim(data.matrix)[1])) normlogs = c(normlogs,data.matrix[,i]) } If you have 3 groups of 3 samples, the code is as follows: sampleNames = vector() normlogs = vector() for (i in 1:9) { sampleNames = c(sampleNames,rep(ph@data[i,1],dim(data.matrix)[1])) normlogs = c(normlogs,data.matrix[,i]) } After having filled the vectors with data, we combine sample names and normalized intensities into a single data frame: normData = data.frame(norm_logInt=normlogs,sampleName=sampleNames) Now we can create the plot. To compare this plot to the boxplot we made for raw log intensities we have to set them to the same Y-scale. The scale for the normalized data is much lower than these for the raw data so we have to make the box plot setting the Y-scale from 2 to 16. To set the Y-scale we can use the ylim() method. dataBox = ggplot(normData, aes(sampleName,norm_logInt)) dataBox + geom_boxplot() + ylim(2,16) + ggtitle("after normalization") Additionally, we have to make the box plot of the raw data again this time setting the Y-scale from 2 to 16. dataBox = ggplot(logData,aes(sampleName,logInt)) dataBox + geom_boxplot() + ylim(2,16) + ggtitle("before normalization") |

After normalization, none of the samples should stand out from the rest. The different arrays should have the same (or at least a very comparable) median expression level. Also the scale of the boxes should be almost the same indicating that also the spread of the intensity values on the different arrays is comparable.
MA plots
Originally these MA plots were developed for two-color arrays to detect differences between the two color labels on the same array, and for these arrays they became hugely popular. This is why more and more people are now also using them for Affymetrix arrays but on Affymetrix only use a single color label. So people started using them to compare each Affymetrix array to a pseudo-array. The pseudo array consists of the median intensity of each probe over all arrays.
The MA plot shows to what extent the variability in expression depends on the expression level (more variation on high expression values?). In an MA-plot, A is plotted versus M:
- M is the difference between the intensity of a probe on the array and the median intensity of that probe over all arrays
M = logPMInt_array – logPMInt_medianarray - A is the average of the intensity of a probe on that array and the median intesity of that probe over all arrays
A = (logPMInt_array + logPMInt_medianarray)/2
The code on this page works for both affy and oligo
| How to plot the MA plot of each array ? |
|---|
MA plots are created via the MAplot() method which can be applied directly on an AffyBatch/FeatureSet object.for (i in 1:6) { name = paste("MAplot",i,".jpg",sep="") jpeg(name) MAplot(data,which=i) dev.off() } The which argument allows you to specify which array to compare with the median array. So if you have 6 arrays, you have to repeat this command 6 times, varying the value of the which argument from 1 to 6. |

Ideally, the cloud of data points should be centered around M=0 (blue line). This is because we assume that the majority of the genes is not DE and that the number of upregulated genes is similar to the number of downregulated genes. Additionally, the variability of the M values should be similar for different A values (average intensities). You see that the spread of the cloud increases with the average intensity: the loess curve (red line) moves further and further away from M=0 when A increases. To remove (some of) this dependency, we will normalize the data.
| How to create an MA plot of the normalized intensities ? |
|---|
MA plots are created via the MAplot() method which can be applied directly on an AffyBatch or ExpressionSet object.for (i in 1:6) { name = paste("MAplotnorm",i,".jpg",sep="") jpeg(name) MAplot(data.rma,which=i) dev.off() } The which argument allows you to specify which array to compare with the median array. So in our example, we have 6 arrays, so we have to repeat this command 6 times, varying the value of the which argument from 1 to 6. |

When you compare this plot to the one created for the raw intensities, you see a much more symmetric and even spread of the data indicating that the dependence of the variability on the average expression level is not as strong as it was before normalization.
Ideally, the cloud of data points in the MA-plot should be centered around M=0 (blue line). This is because we assume that the majority of the genes is not DE and that the number of upregulated genes is similar to the number of downregulated genes. Additionally, the variability of the M values should be similar across different array-medianarray combinations. You see that the spread of the point cloud increases with the average intensity: the loess curve (red line) moves further and further away from M=0 when A increases. To remove (some of this) dependency, we will normalize the data.
Calculate quality measures to assess the quality of the data
Calculate quality measures in affy
Apart from images, you can also calculate simple quality metrics to assess the quality of the arrays.
| How to calculate the quality measures of each array ? |
|---|
Quality measures can be calculated by applying the qc() method on an AffyBatch object.data.qc = qc(data) The first quality measure are the average intensities of the background probes on each array. avbg(data.qc) The second quality measure are the scale factors: factors used to equalize the mean intensities of the arrays. sfs(data.qc) The third quality measure are the percent present calls: the percentage of spots that generate a significant signal (significantly higher than background) according to the Affymetrix detection algorithm. percent.present(data.qc) The last quality measure are the 3’/5′ ratios of the quality control probe sets representing housekeeping genes (genes expressed in any tissue in any organism) like actin and GADPH. For these housekeeping genes 3 probe sets are available: one at the 5′ end of the gene, one at the middle and one at the 3′ end of the gene. ratios(data.qc) |
Calculate quality measures in oligo
The qc() method is implemented in the simpleaffy package but not in the oligo package. This means that you either have to
- load both simpleaffy and oligo but then you always have the problem that you have to explicitly write oligo:: in front of every method you want to use from the oligo package
- first load simpleaffy, perform the qc() analysis, restart R, load oligo and perform the rest of the analysis
Normalization of microarray data
There are many sources of noise in microarray experiments:
- different amounts of RNA used for labeling and hybridization
- imperfections on the array surface
- imperfect synthesis of the probes
- differences in hybridization conditions
Systematic differences between the samples that are due to noise rather than true biological variability should be removed in order to make biologically meaningfull conclusions about the data.
Normalization using RMA
The code in this section works for both affy and oligo
The standard method for normalization is RMA. RMA is one of the few normalization methods that only uses the PM probes:
- Background correction to correct for spatial variation within individual arrays: a background-corrected intensity is calculated for each PM probe in such a way that all background corrected intensities are positive
- Log transformation to improve the distribution of the data: the base-2 logarithm of the background corrected intensity is calculated for each probe. The log transformation will make the data less skewed and more normally distributed and provide an equal spread of up- and downregulated expression ratios
- Quantile normalization to correct for variation between the arrays: equalizes the data distributions of the arrays and make the samples completely comparable
- Probe normalization to correct for variation within probe sets: equalizes the behavior of the probes between the arrays and combines normalized data values of probes from a probe set into a single value for the whole probe set
| How to normalize the data using RMA ? |
|---|
The rma() method in the affy package produces a data matrix for Affymetrix arrays. The input for rma() is an AffyBatch object while the output from rma() is an exprSet object with the data matrix containing the normalized log-intensities in the exprs slot.data.rma = rma(data) data.matrix = exprs(data.rma) The ExpressionSet class is the superclass of the AffyBatch class meaning that AffyBatches are a special type of ExpressionSets. AffyBatches will therefore have the same characteristics and behaviour as ExpressionSets but AffyBatches will also have a set of specific characteristics and functions that are not shared by ExpressionSets. |
Normalization using GCRMA
GCRMA in affy
GCRMA is based on RMA, having all the good sides of RMA. The difference lies in the background correction, all other steps are the same. GCRMA corrects for non-specific binding to the probes in contrast to RMA which completely ignores the issue of non-specific binding.
GCRMA uses probe sequence information to estimate probe affinity to non-specific binding. Each nucleotide of the probe contributes to the affinity of the probe. The contributions of each nucleotide on each position of the probes were estimated in a pilot experiment with artificial DNAs that mismatch the probes, done by the people who developed the algorithm. In this experiment there was no specific binding so the only thing was measured was non-specific binding. The data of this experiment allowed to estimate the affinities of the probes.
GCRMA allows you to use the affinities calculated based on this reference experiment or you can let GCRMA compute probe affinities based on the signals of the negative control probes of your own microarray experiment.
The gcrma package contains all available methods to perform GCRMA normalization.
| How to do a GCRMA normalization ? |
|---|
First of all, you need to load the gcrma package:library(“gcrma”) To perform GCRMA normalization: data.gcrma = gcrma(data) As said before, GCRMA uses the affinity of each probe during background correction. These probe affinities are stored in an AffyBatch object, called affinity.info. my.affinity.info = compute.affinities.local(data) data.gcrma = gcrma(data,affinity.info=my.affinity.info) The gcrma command comes with two additional arguments
So to speed up calculations use the following command: data.gcrma = gcrma(data,fadt=TRUE) |
GCRMA in oligo
GCRMA makes use of the IndexProbes() method a lot, which is a method that works on AffyBatches and is not implemented for FeatureSets. As a result, there is no easy way to do GCRMA normalization in the oligo package.
How to compare raw and back
ground-corrected microarray data
Comparing raw and background-corrected data after RMA
| How to create a plot of raw versus background corrected intensities using ggplot ? |
|---|
| We cannot use the output of the rma() method since the rma() method performs three additional steps on the data (log transformation, quantile normalization and probe normalization). The bg.correct() method allows us to perform only a background correction, the method argument specifies which method is to be used for background correction. We want the one that is used by RMA and we want to apply it only on the PM intensities since RMA only uses the PM intensities. bgcorr = pm(bg.correct(data,method="rma")) First we need to get the data in the correct format for ggplot: a data frame with:
 We will work with PM intensities only pmexp = pm(data) We create three empty vectors that will serve as the three columns of the data frame:
The initialization of these vectors is essential. If you run into problems when creating these vectors and you have to repeat the plotting, always reinitialize these vectors (recreate them so that they are empty). The dim() method returns the number of rows (probes) and columns (samples) of the matrix containing the PM intensities. The number of rows corresponds to the number of PM intensities (probes) that is available for each sample (in this example that’s 251078). The sampleNames vector needs the same number of rows consisting of sample names. The logs and the corrlogs vector will contain the log PM intensities of all six samples stacked into a single column. Up to this point we have extracted raw PM intensities, they are not yet log-transformed! You can do the log transformation using the log2() method. sampleNames = vector() logs = vector() corrlogs = vector() for (i in 1:6) { sampleNames = c(sampleNames,rep(ph@data[i,1],dim(pmexp)[1])) logs = c(logs,log2(pmexp[,i])) corrlogs = c(corrlogs,log2(bgcorr[,i])) } If you have 3 groups of 3 replicates, the code is as follows: sampleNames = vector() logs = vector() corrlogs = vector() for (i in 1:9) { sampleNames = c(sampleNames,rep(ph@data[i,1],dim(pmexp)[1])) logs = c(logs,log2(pmexp[,i])) corrlogs = c(corrlogs,log2(bgcorr[,i])) } Then we combine sample names and log intensities into one data frame: corrData = data.frame(logInt=logs,bgcorr_logInt=corrlogs,sampleName=sampleNames) Now we can create the plot. We use the geom_abline() method to add a red diagonal to the plot: dataScatter = ggplot(corrData, aes(logInt,bgcorr_logInt)) dataScatter + geom_point() + geom_abline(intercept=0,slope=1,colour='red') + facet_grid(.~sampleName) |

If there is no difference between raw and background corrected data, the data points should end up on the diagonal. This is of course not the case. Only low intensities are strongly affected by the background subtraction: this is normal since the background intensity is a small value. Subtracting a small value from a small value has a much bigger impact than subtracting a small value from a high value.
Comparing raw and background corrected data after GCRMA
| How to create a plot of raw versus background corrected intensities after GCRMA ? |
|---|
| We cannot use the output of the gcrma() method since the gcrma() method performs three additional steps on the data (log transformation, quantile normalization and probe normalization). The bg.adjust.gcrma() method allows us to perform only a gcrma background correction. bgcorr = bg.adjust.gcrma(data) The rest of the plot is created in exactly the same manner as described above for the RMA method. |
Checking the effect of the normalization
Comparing raw and background-corrected data
Comparing raw and background-corrected data after RMA
| How to create a plot of raw versus background corrected intensities using ggplot ? |
|---|
| We cannot use the output of the rma() method since the rma() method performs three additional steps on the data (log transformation, quantile normalization and probe normalization). The bg.correct() method allows us to perform only a background correction, the method argument specifies which method is to be used for background correction. We want the one that is used by RMA and we want to apply it only on the PM intensities since RMA only uses the PM intensities. bgcorr = pm(bg.correct(data,method="rma")) First we need to get the data in the correct format for ggplot: a data frame with:
We will work with PM intensities only pmexp = pm(data) We create three empty vectors that will serve as the three columns of the data frame:
The initialization of these vectors is essential. If you run into problems when creating these vectors and you have to repeat the plotting, always reinitialize these vectors (recreate them so that they are empty). The dim() method returns the number of rows (probes) and columns (samples) of the matrix containing the PM intensities. The number of rows corresponds to the number of PM intensities (probes) that is available for each sample (in this example that’s 251078). The sampleNames vector needs the same number of rows consisting of sample names. The logs and the corrlogs vector will contain the log PM intensities of all six samples stacked into a single column. Up to this point we have extracted raw PM intensities, they are not yet log-transformed! You can do the log transformation using the log2() method. sampleNames = vector() logs = vector() corrlogs = vector() for (i in 1:6) { sampleNames = c(sampleNames,rep(ph@data[i,1],dim(pmexp)[1])) logs = c(logs,log2(pmexp[,i])) corrlogs = c(corrlogs,log2(bgcorr[,i])) } If you have 3 groups of 3 replicates, the code is as follows: sampleNames = vector() logs = vector() corrlogs = vector() for (i in 1:9) { sampleNames = c(sampleNames,rep(ph@data[i,1],dim(pmexp)[1])) logs = c(logs,log2(pmexp[,i])) corrlogs = c(corrlogs,log2(bgcorr[,i])) } Then we combine sample names and log intensities into one data frame: corrData = data.frame(logInt=logs,bgcorr_logInt=corrlogs,sampleName=sampleNames) Now we can create the plot. We use the geom_abline() method to add a red diagonal to the plot: dataScatter = ggplot(corrData, aes(logInt,bgcorr_logInt)) dataScatter + geom_point() + geom_abline(intercept=0,slope=1,colour='red') + facet_grid(.~sampleName) |
If there is no difference between raw and background corrected data, the data points should end up on the diagonal. This is of course not the case. Only low intensities are strongly affected by the background subtraction: this is normal since the background intensity is a small value. Subtracting a small value from a small value has a much bigger impact than subtracting a small value from a high value.
Comparing raw and background corrected data after GCRMA
| How to create a plot of raw versus background corrected intensities after GCRMA ? |
|---|
| We cannot use the output of the gcrma() method since the gcrma() method performs three additional steps on the data (log transformation, quantile normalization and probe normalization). The bg.adjust.gcrma() method allows us to perform only a gcrma background correction. bgcorr = bg.adjust.gcrma(data) The rest of the plot is created in exactly the same manner as described above for the RMA method. |
Comparing raw and normalized data
Comparing raw and normalized data in affy
After normalization you can compare raw and normalized data. You can do this for individual genes or for all genes.
We’ll start by making the comparison for individual genes.
| How to compare raw and normalized intensities for individual genes ? |
|---|
The normalized intensities are stored in data.matrix. The probe set IDs are used as row names:data.matrix["256852_at",] Raw intensities are stored in data, you can retrieve the raw PM intensities by using the pm() method. By using the probe set ID as a second argument, you can retrieve the PM intensities of the row with this name: pm(data,"256852_at")  |
Comparing raw and normalized data in oligo
After normalization oligo does use probe set IDs as row names in the data.matrix object so you can retrieve normalized data for a specific probe set e.g. for HTA 2.0 arrays:
data.matrix["2824546_st",]
However, retrieving raw data by specifying a probe set ID in the pm() method does not work in oligo.
Comparing raw and normalized data using boxplots
The code on this page works for both affy and oligo
| How to plot the box plots of the raw data of each array ? |
|---|
Box plots are created via the boxplot() method which can be applied directly on an AffyBatch/FeatureSet object.name = "boxplot.jpg" jpeg(name) boxplot(data,which='pm',col='red',names=ph@data$sample) dev.off() The which argument allows you to specify if you want to use:
Since the use of MM probes is highly controversial, we will work with PM probes only. |
Box plots allow you to assess if the scale and distribution of the data on different arrays is comparable. Differences in shape or center of the boxes indicate that normalization of the data is required.
You can also create box plots using ggplot.
| How to create the box plot of the raw data using ggplot ? |
|---|
| First we need to get the data in the correct format for ggplot: a data frame with log intensities in one column and sample names in the second column. We’ll only use the PM intensities pmexp = pm(data) We create two empty vectors that will serve as the two columns of the data frame:
The initialization of these vectors is essential. If you run into problems when creating these vectors and you have to repeat the plotting, always reinitialize these vectors (recreate them so that they are empty) The dim() method returns the number of rows (probes) and columns (samples) of the matrix containing the PM intensities. The number of rows corresponds to the number of PM intensities (probes) that is available for each sample (in this example that’s 251078). The sampleNames vector needs the same number of rows consisting of sample names. The logs vector will contain the log PM intensities of all six samples stacked into a single column. Up to this point we have extracted raw PM intensities, they are not yet log-transformed! You can do the log transformation using the log2() method. sampleNames = vector() logs = vector() for (i in 1:6) { sampleNames = c(sampleNames,rep(ph@data[i,1],dim(pmexp)[1])) logs = c(logs,log2(pmexp[,i])) } If you have 3 groups of 3 replicates, the code is as follows: sampleNames = vector() logs = vector() for (i in 1:9) { sampleNames = c(sampleNames,rep(ph@data[i,1],dim(pmexp)[1])) logs = c(logs,log2(pmexp[,i])) } After we have filled the vectors with the data we need, we combine sample names and log intensities into a single data frame: logData = data.frame(logInt=logs,sampleName=sampleNames) Now we can create the plot: dataBox = ggplot(logData,aes(sampleName,logInt)) dataBox + geom_boxplot() |
| How to create a boxplot of normalized intensities ? |
|---|
It’s the same code as for raw intensities but this you use the normalized intensities as input (data.matrix) instead of the raw data:name = "boxplotnorm.jpg" jpeg(name) boxplot(data.matrix,col='red',names=ph@data$sample) dev.off() |
| How to create a box plot of normalized intensities using ggplot ? |
|---|
| First we need to get the data in the correct format for ggplot: a data frame with normalized log intensities in one column and sample names in the second column. We create two vectors:
The dim() method returns the number of rows (probe sets) and columns (samples) of the matrix containing the normalized intensities. The number of rows corresponds to the number of normalized intensities (probe sets) in each sample (in this example it’s 22810). The sampleNames vector needs the same number of entries of each sample name stacked into a single column. The normlogs vector will contain the normalized intensities of all six samples stacked into a single column. sampleNames = vector() normlogs = vector() for (i in 1:6) { sampleNames = c(sampleNames,rep(ph@data[i,1],dim(data.matrix)[1])) normlogs = c(normlogs,data.matrix[,i]) } If you have 3 groups of 3 samples, the code is as follows: sampleNames = vector() normlogs = vector() for (i in 1:9) { sampleNames = c(sampleNames,rep(ph@data[i,1],dim(data.matrix)[1])) normlogs = c(normlogs,data.matrix[,i]) } After having filled the vectors with data, we combine sample names and normalized intensities into a single data frame: normData = data.frame(norm_logInt=normlogs,sampleName=sampleNames) Now we can create the plot. To compare this plot to the boxplot we made for raw log intensities we have to set them to the same Y-scale. The scale for the normalized data is much lower than these for the raw data so we have to make the box plot setting the Y-scale from 2 to 16. To set the Y-scale we can use the ylim() method. dataBox = ggplot(normData, aes(sampleName,norm_logInt)) dataBox + geom_boxplot() + ylim(2,16) + ggtitle("after normalization") Additionally, we have to make the box plot of the raw data again this time setting the Y-scale from 2 to 16. dataBox = ggplot(logData,aes(sampleName,logInt)) dataBox + geom_boxplot() + ylim(2,16) + ggtitle("before normalization") |
After normalization, none of the samples should stand out from the rest. The different arrays should have the same (or at least a very comparable) median expression level. Also the scale of the boxes should be almost the same indicating that also the spread of the intensity values on the different arrays is comparable.
How to create MA plot of microarray data
The code on this page works for both affy and oligo
| How to plot the MA plot of each array ? |
|---|
MA plots are created via the MAplot() method which can be applied directly on an AffyBatch/FeatureSet object.for (i in 1:6) { name = paste("MAplot",i,".jpg",sep="") jpeg(name) MAplot(data,which=i) dev.off() } The which argument allows you to specify which array to compare with the median array. So if you have 6 arrays, you have to repeat this command 6 times, varying the value of the which argument from 1 to 6. |
Ideally, the cloud of data points should be centered around M=0 (blue line). This is because we assume that the majority of the genes is not DE and that the number of upregulated genes is similar to the number of downregulated genes. Additionally, the variability of the M values should be similar for different A values (average intensities). You see that the spread of the cloud increases with the average intensity: the loess curve (red line) moves further and further away from M=0 when A increases. To remove (some of) this dependency, we will normalize the data.
| How to create an MA plot of the normalized intensities ? |
|---|
MA plots are created via the MAplot() method which can be applied directly on an AffyBatch or ExpressionSet object.for (i in 1:6) { name = paste("MAplotnorm",i,".jpg",sep="") jpeg(name) MAplot(data.rma,which=i) dev.off() } The which argument allows you to specify which array to compare with the median array. So in our example, we have 6 arrays, so we have to repeat this command 6 times, varying the value of the which argument from 1 to 6. |
When you compare this plot to the one created for the raw intensities, you see a much more symmetric and even spread of the data indicating that the dependence of the variability on the average expression level is not as strong as it was before normalization.
How to create a PCA plot of microarray data
The code on this page works for both affy and oligo
PCA performs a transformation of the data into principal components. Principal components (PCs) are linear combinations of probe sets (or genes), ranked in such a way that the first PC is the linear combination of probe sets that captures the direction of the largest variation in the data set. The second PC captures the second largest variation in the data set and so on…
The first PC is an axis in space, so you can project each sample on this axis and the variance between the projected samples will be the highest among all possible choices of first axis. The second PC is another axis in space, perpendicular to the first. Projecting the samples on these two axes generates the plot that you see below in which the variation between the samples is as large as possible.
| How to create a PCA plot ? |
|---|
To create a PCA plot you can use the prcomp() method. Input is the matrix containing the normalized expression levels obtained by applying the exprs() method on data.rma. So for an experiment of 3 groups of 3 samples:color=c('green','green','green','red','red','red','blue','blue','blue') data.PC = prcomp(t(data.matrix),scale.=TRUE) plot(data.PC$x[1:2],col=color) |

When you have groups in your data this should lead to a clear distinction between the groups.
Identification of DE genes
Identification of DE genes is not done by the affy nor the oligo package but by the limma package. Limma uses the output of the rma() method (data.rma) as input. Since the output of the rma() method is the same in the affy and in the oligo package, limma works well with both packages. This means that all following code is valid for all normalized Affymetrix data regardless of the package that was used for normalization.
Two groups of samples
The limma package contains functions for using a t-test or an ANOVA to identify differential expression in microarray data. These functions can be used for all array platforms and work even for microarray data with complex designs of multiple samples. The central idea is to fit a linear model to the expression data of each gene. The expression data can be log-ratios or log-intensities. Computational methods are used to borrow information across genes making the analyses stable even for experiments with a small number of arrays. Limma is designed to be used in conjunction with the affy package.
| How to use limma for comparing two groups of samples ? |
|---|
First of all you need to tell limma which samples are replicates and which samples belong to different groups by providing this information in the phenoData slot of the AffyBatch/FeatureSet. To this end, we add a second column with sample annotation describing the source of each sample. We will give this new column a name.ph@data[ ,2] = c("control","control","control","mutant","mutant","mutant") colnames(ph@data)[2]="source" ph@data Now you need to tell limma which sample belongs to which group. This info is contained in the second column (the column that we called source) of the PhenoData. groups = ph@data$source The names of the groups have to be transformed into factors. Factors in statistics represent the variable that you control: which sample belongs to which group. You can factorize the grouping variable by using the factor() method f = factor(groups,levels=c("control","mutant")) Then you need to create a design matrix, a matrix of values of the grouping variable. ANOVA needs such a matrix to know which samples belong to which group. Since limma performs an ANOVA or a t-test (which is just a specific case of ANOVA), it needs such a design matrix. You can create it using the model.matrix() method. design = model.matrix(~ 0 + f) colnames(design) = c("control","mutant") Essentially, limma will compare the mean expression level in the control samples to the mean expression level in mutant samples and this for each gene. So first of all, limma needs to calculate the mean expression levels using the lmFit() method. This method will fit a linear model (defined in design) to the data to calculate the mean expression level in the control and in the mutant samples: data.fit = lmFit(data.matrix,design) You can view the results of the fit. For instance you can show the estimates of the fit for the first 10 probe sets. data.fit$coefficients[1:10,]  The first column contains the mean log expression in control samples. Now you have to tell limma which groups you want to compare. For this you define a contrast matrix defining the contrasts (comparisons) of interest by using the makeContrasts() method. Using the column names of the design matrix you specify the baseline sample (control) you want to compare to and the sample of interest (mutant). contrast.matrix = makeContrasts(mutant-control,levels=design) data.fit.con = contrasts.fit(data.fit,contrast.matrix) Now limma is ready to perform the statistical test to compare the groups. Since we are comparing two groups, it will perform a t-test. data.fit.eb = eBayes(data.fit.con) The eBayes() method returns a data frame data.fit.eb containing multiple slots. To get an overview of all the slots, use the names() method: names(data.fit.eb) You can retrieve the log fold changes of each gene via the coefficients slot: data.fit.eb$coefficients[1:10,] This slot contains the coefficient of the contrast: it’s simply the difference between the mean log expression in mutant samples and the mean log expression in control samples. This difference is usually called a log fold change.  The eBayes() method has performed a moderated t-test on each gene. That means it has calculated a t-statistic and a corresponding p-value for each gene. These values can be found in the t and the p.valuje slot. To view the t-statistics and p-values of the moderated t-test for the first 10 probe sets: data.fit.eb$t[1:10,] data.fit.eb$p.value[1:10,]  Remarkably, data.fit.eb also contains F-statistics and p-values for this F-statistic in the F and F.p.value slots while an F-statistic is in an ANOVA. Essentially, a t-test is a special case of an ANOVA used for single comparisons. If you have just a single comparison the F-statistic is the square of the t-statistic. For multiple comparisons, this relation is not true.  |
In the above example we compared samples from two groups but in many microarray experiments, there are more than two groups. In this case we have to perform a moderated one-way ANOVA for each gene.
Three groups of samples
| How to compare three groups ? |
|---|
| As an example we will compare drug treated mice and mice treated with physical exercise to a set of control mice. First of all you need to tell limma which samples are replicates and which samples belong to different groups by providing this information in the phenoData slot of the AffyBatch/FeatureSet. To this end, we add a second column with sample annotation describing the source of each sample. We will give this new column a name: ph@data[ ,2] = c("control","control","control","drug","drug","drug","exercise","exercise","exercise") colnames(ph@data)[2]="source" ph@data Since we have 3 groups with 3 replicates each, the factor that determines the grouping will have 3 levels instead of 2, so the code is as follows: f = factor(groups,levels = c("control","drug","exercise")) Then you need to create a design matrix, a matrix of values of the grouping variable. ANOVA needs such a matrix to know which samples belong to which group. Since limma performs an ANOVA, it needs such a design matrix. You can create it using the model.matrix() method. design = model.matrix(~ 0 + f) colnames(design)=c("control","drug","exercise") design data.fit = lmFit(data.rma,design)  Afterwards you can tell limma which groups you want to compare. For this you define a contrast matrix defining the contrasts (comparisons) of interest by using the makeContrasts() method. In this example we make all pairwise comparisons: contrast.matrix = makeContrasts(exercise-control,drug-exercise,drug-control,levels=design) data.fit.con = contrasts.fit(data.fit,contrast.matrix) data.fit.eb = eBayes(data.fit.con) You can view the results of the ANOVA in the slots of the data.fit.eb object. The statistic that is calculated in ANOVA is the F-statistic, you can find the F-statistic and its corresponding p-value for each gene in the F and F.p.value slots. data.fit.eb$coefficients[1:10,] data.fit.eb$t[1:10,] data.fit.eb$p.value[1:10,] data.fit.eb$F[1:10] data.fit.eb$F.p.value[1:10] |
Paired data
Up to now we have always assumed that the groups are independent, meaning that samples of one group have no relation whatsoever with samples from another group. In independent data sets you have two groups of subjects (patients, mice, plants,….). You use one group as controls and you give the other group a treatment.
Paired or dependent data means that there exists a relationship between the samples of different groups. The typical example is having a group of subjects and measuring each of them before and after treatment.
It is important to tell limma if your data is paired or not since you need to use a different type of statistical test on paired compared to independent data:
- paired t-test instead of regular two-samples t-test
- repeated measures ANOVA instead of regular one-way ANOVA
| How to compare two groups of paired data ? |
|---|
As an example we will compare 2 groups of 3 patients before and after treatment: Treatment is the grouping variable dividing the data set into two groups: before and after treatment. To tell limma that your data is paired you just create a second grouping variable called patient: ph@data[ ,2] = c("before","treated","before","treated","before","treated") colnames(ph@data)[2]="Treatment" ph@data[ ,3] = c("patient1","patient1","patient2","patient2","patient3","patient3") colnames(ph@data)[3]="Patient" ph@data Of course, now you need to factorize both grouping variables: groupsP = ph@data$Patient groupsT = ph@data$Treatment fp = factor(groupsP,levels=c("patient1","patient2","patient3")) ft = factor(groupsT,levels=c("before","treated")) Then you need to create a design matrix, a matrix of values of the grouping variable. ANOVA needs such a matrix to know which samples belong to which group. Since limma performs an ANOVA, it needs such a design matrix. You can create it using the model.matrix() method. paired.design = model.matrix(~ fp + ft) colnames(paired.design)=c("Intercept","Patient2vsPatient1","Patient3versusPatient1","AftervsBefore") data.fit = lmFit(data.rma,paired.design) data.fit$coefficients Lmfit() will fit a linear model to the data. It will create a data frame called data.fit. The interesting data is in the coefficients table which contains 4 columns:
Performing a moderated paired t-test is now done using eBayes(). data.fit.eb = eBayes(data.fit) data.fit.eb$p.value[,1:20] Again, the relevant p-values are in the fourth column, called Treatment. These are the p-values generated by the comparison of after treatment and before treatment. |
| How to compare three groups of paired data ? |
|---|
As an example we will compare 3 groups of 3 patients before, during and after treatment: Treatment is the grouping variable dividing the data set into two groups: before and after treatment. To tell limma that your data is paired you just create a second grouping variable called patient: ph@data[ ,2] = c("before","during","treated","before","during","treated","before","during","treated") colnames(ph@data)[2]="Treatment" ph@data[ ,3] = c("P1","P1","P1","P2","P2","P2","P3","P3","P3") colnames(ph@data)[3]="Patient" ph@data Of course, now you need to factorize both grouping variables: groupsP = ph@data$Patient groupsT = ph@data$Treatment fp = factor(groupsP,levels=c("P1","P2","P3")) ft = factor(groupsT,levels=c("before","during","treated")) Then you need to create a design matrix, a matrix of values of the grouping variable. ANOVA needs such a matrix to know which samples belong to which group. Since limma performs an ANOVA, it needs such a design matrix. You can create it using the model.matrix() method. paired.design = model.matrix(~ fp + ft) colnames(paired.design)=c("Intercept","P2vsP1","P3vsP1","DuringvsBefore","AftervsBefore") data.fit = lmFit(data.rma,paired.design) data.fit$coefficients Lmfit() will fit a linear model to the data. It will create a data frame called data.fit. The interesting data is in the coefficients table which contains 5 columns:
Performing the repeated measures ANOVA is now done using eBayes(). data.fit.eb = eBayes(data.fit) data.fit.eb$p.value[,1:20] Again, the relevant p-values are in the fourth and fifth column, called DuringvsBefore and AftervsBefore. These are the p-values generated by the comparison of bfore, during and after treatment. What if you also want to compare after and during treatment ? cont.matrix = makeContrasts(aftervsduring=after-during,levels=paired.design) data.contr = contrasts.fit(data.fit,cont.matrix) data.contr$coefficients data.fit.eb = eBayes(data.contr) |
Two grouping variables
Sometimes you have two grouping variables, e.g.
- gender and treatment if you think a drug has a different effect on men and women
- strain and treatment if you think a drug has a different effect on different mice strains
How to compare microarray data grouped according to two variables
As an example we will compare 4 groups of plants:
1. healthy control plants
2. plants infected with a pathogen
3. plants inhabited by beneficial microorganisms
4. plants inhabited by beneficial microorganisms and infected with a pathogen
It means that we have two grouping variables: pathogen and beneficial MO. All four combinations of pathogen and beneficial MO are observed, so this is a two-factor design.
It is especially important with a multi-factor design to decide what are the comparisons of interest. We want to know which genes respond to:
- which genes respond to the pathogen infection in healthy plants: compare 2 and 1
- which genes respond to the benifical MO in healthy plants: compare 3 and 1
- which genes respond to the pathogen infection in beneficial MO inhabited plants: compare 4 and 3
| [show]How to compare four groups defined by two grouping variables ? |
|---|
This approach for analyzing two-factor deigns is recommended for most users, because the contrasts that are being tested are defined explicitly. It will work for simple comparisons.
However, if you want to see if the genes that respond to pathogen infection are different in BMO inhabited and control plants, you need to use an interaction term in the design matrix. To do this, you use a model formula.
Model formulas in R offer lots of extras for setting up the design matrix. However, they also require a high level of statistical understanding in order to use reliably, and they are not well described in the main R documentation.
| [show]How to compare four groups defined by two grouping variables using an interaction term ? |
|---|
The two approaches considered are equivalent and should yield identical results for corresponding comparisons.
More info on creating design matrices can be found in the limma user guide
Generating a Volcano plot
The best way to decide on the number of DE genes you are going to select is via a Volcano plot.
| How to generate a Volcano plot of the data ? |
|---|
| A Volcano plot is generated by using the volcanoplot() method on the output of the moderated t-test. The coef parameter specifies the column of data.fit.eb that should be used for the plot. In our example in Arabidopsis coef=2 since the second column of data.fit.eb contains the results of the comparison between mutant and control plants.
So in this example you set coef=2 or coef=3 if you want to find genes that are DE between patients or coef=4 if you want to find genes that are DE as a result of the treatment.
The highlight parameter allows to specify the number of highest scoring genes (on the Y-axis) for which names will be attached on the plot. name = "Volcano.jpg" jpeg(name) volcanoplot(data.fit.eb,coef=2,highlight=10) dev.off() |

Volcano plots arrange genes along biological and statistical significance. The X-axis gives the log fold change between the two groups (log: so that up and down regulation appear symmetric), and the Y-axis represents the p-value of a t-test comparing samples (on a negative log scale so smaller p-values appear higher up). The first axis indicates biological impact of the change; the second indicates the statistical evidence of the change.
To decide on the number of DE genes that you’re going to proceed with, you can make Volcano plots highlighting different numbers of genes. As you increase the number of genes highlighted on the plot, you can see at what point you begin to select genes with rather low fold changes. Make a conservative decision about the number of genes you want to use for follow up.
Adjusting for multiple testing and defining DE genes
You are doing a t-test on each gene, meaning that you will be doing more than 20000 t-tests on the data set. You have to adjust the p-values of the t-tests for multiple testing or you will generate too many false positives.
Of course your final aim is to generate a table containing the genes that you consider DE (the genes with the lowest adjusted p-values and the most extreme log fold changes). You can then use this table to search for functional relations between these genes…
Creating lists of probe set IDs of DE genes for functional analysis
We go back to our simple comparison of mutant and wild-type samples. We have created a list of upregulated genes called topups and a list of downregulated genes (topdowns).
| How to create a list of IDs of genes that are DE according to topTable() ? |
|---|
The tab table that is generated by the topTable() method and all the tables that are derived from it like topups and topdowns contain the probe set IDs of the selected genes as row names:IDs.up = rownames(topups) IDs.down = rownames(topdowns) |
What if you used decideTests() to identify DE genes ? This method generates a matrix containing labels (0, 1 or -1) for each gene in each contrast.
| How to create a list of IDs of genes that are DE according to decideTests() ? |
|---|
| Assume that we want to obtain the lists of genes that are up/downregulated in the exercise group compared to the control group. The labels for this contrast are stored in the first column of the DEresults matrix that was generated by the decideTests() method. First you select the upregulated genes (genes with value 1 in the first column) via the subset() method. Then you obtain their IDs via the rownames() method. ups = subset(DEresults, DEresults[,1]==1) downs = subset(DEresults, DEresults[,1]==-1) IDs.up = rownames(ups) IDs.down = rownames(downs) |
You’ll probably want to write the list of IDs to your computer so that you can use it in tools like DAVID.
| How to write the probe set IDs of the DE genes to your computer ? |
|---|
We will create a text file with one ID on each line since this is a format that is accepted by most tools. You can do this by using the write.table() method.
write.table(IDs.up,row.names=FALSE,col.names=FALSE,quote=FALSE,file="d:/trainingen/R/upIDs.txt") write.table(IDs.down,row.names=FALSE,col.names=FALSE,quote=FALSE,file="d:/trainingen/R/downIDs.txt") |
Creating a heat map of the DE genes
| How to create a heat map of the normalized intensities of the DE genes ? |
|---|
In this example we will create a heat map of the downregulated genes. Heat maps can be created via the ggplot() method. As always we need to get the data into the correct format for ggplot: a data matrix with
 We first have to obtain the normalized intensities of the upregulated genes. The normalized intensities are stored in data.matrix. The downregulated genes are stored in topdowns. We can obtain their probe set IDs via the rownames() method. Then we select their normalized intensites from data.matrix using their probe set IDs: data.matrix.up = data.matrix[(rownames(topdowns)),] We create three vectors:
The heatlogs vector will contain the normalized intensities of the upregulated genes in all six samples stacked into a single column. There are 71 downregulated genes in my data set. I can see that by using the dim() method and looking at the first number it returns (dim(topdowns)[1]). This means that the sampleNames vector needs 254 entries of each sample name stacked into a single column. The featureNames vector needs the probe set IDs of these genes repeated 6 times and stacked into a single column. sampleNames = vector() featureNames = vector() heatlogs = vector() for (i in 1:6) { sampleNames = c(sampleNames,rep(ph@data[i,1],dim(topdowns)[1])) featureNames = c(featureNames,rownames(data.matrix.up[1:dim(topdowns)[1],])) heatlogs = c(heatlogs,data.matrix.up[1:dim(topdowns)[1],i]) } Then we combine sample names, probe set IDs and normalized intensities into one data frame: heatData = data.frame(norm_logInt=heatlogs,sampleName=sampleNames,featureName=featureNames) Now we can create the plot. A heat map can be created using the geom_tile() method. Low normalized intensities will be plotted in green and high normalized intensities will be plotted in red. This can be done by using the scale_fill_gradient() method. dataHeat = ggplot(heatData, aes(sampleName,featureName)) dataHeat + geom_tile(aes(fill=norm_logInt)) + scale_fill_gradient(low="green", high="red") |

Creating a Venn diagram to compare results of multiple comparisons
This can be easily done on the output of the decideTests() method.
| How to create a Venn diagram ? |
|---|
A Venn diagram can be created using the vennDiagram() method.vennDiagram(DEresults) |
Related posts:
![bioinformatics-sequence]()
What are sequence databases and how are they used in bioinformatics?
bioinformatics![Immunoinformatics]()
Immunology and Immunoinformatics
bioinformatics![data-science]()
Introducing Data Science to Undergraduate Students: A Practical Approach Using Bioinformatics
bioinformatics![data-science]()
Comprehensive Data Science with Python: From Basics to Advanced Techniques
bioinformatics![A Step-by-Step Guide to Molecular Dynamics (MD) Simulations Using Web-Based Tools: Case Study on AWS...]()
A Step-by-Step Guide to Molecular Dynamics (MD) Simulations Using Web-Based Tools: Case Study on AWS...
bioinformatics![bioinformatics jobs]()
Climbing the Career Ladder in Bioinformatics: Skills and Tips for Getting Ahead
bioinformatics![AI and bioinformatics]()
Utilizing ChatGPT in Bioinformatics Education: A Guide to the REFINED Strategy
A.I![HTML-bioinformatics]()
HTML for Bioinformatics: A Comprehensive Guide for Structuring and Presenting Scientific Data
bioinformatics![variantcalling-bioinformatics]()
Database of Patented Drugs: A Comprehensive Guide
bioinformatics![python-bioinformatics-basics]()
Step-by-Step Guide: Removing Duplicate Sequences in FASTA Files
bioinformatics![humans-AI]()
Who Can Benefit from Learning AI?
A.I![AI-drug discovery]()
How Bioinformatics is Transforming the Pharmaceutical Industry
bioinformatics![next-generation-sequencing-technology]()
Generative AI in De Novo Drug Design
A.I![Cutting-Edge Bioinformatics Techniques]()
How To Filter Multi-FASTA By Length?
bioinformatics![Omics data analysis]()
Step-by-Step Guide to Convert SAM to BAM
bioinformatics![herapeutic Potential of Long Non-coding RNAs]()
Essential Bioinformatics Tools for Diverse Applications: Sequencing, Structure Visualization, and Da...
bioinformatics