Mastering Data Visualization in R for Bioinformatics
March 24, 2024 Off By adminTable of Contents
ToggleIntroduction to Data Visualization
Importance of data visualization in bioinformatics
Data visualization plays a crucial role in bioinformatics for several reasons:
- Insights from complex data: Bioinformatics deals with vast amounts of complex biological data. Visualization helps in understanding this data by presenting it in a visual format, making it easier to identify patterns, trends, and outliers.
- Communication: Visualizations are effective tools for communicating findings to a wider audience, including researchers, clinicians, and the general public. They can convey complex biological concepts in a more understandable and engaging manner.
- Hypothesis generation: Visualization can spark new hypotheses by revealing unexpected relationships or patterns in the data that might have been overlooked otherwise.
- Quality assessment: Visualization aids in assessing the quality of the data, helping researchers identify errors, inconsistencies, or biases that need to be addressed.
- Decision-making: Visualizations can support decision-making processes by providing clear, concise, and actionable information based on the data.
- Integration of multi-omics data: With the advent of technologies like genomics, transcriptomics, proteomics, and metabolomics, bioinformatics often deals with integrating data from multiple sources. Visualization helps in integrating and analyzing this multi-omics data.
- Exploratory analysis: Visualization allows for interactive exploration of data, enabling researchers to delve deeper into the data and extract meaningful insights.
Overall, data visualization is a powerful tool in bioinformatics that enhances data understanding, facilitates communication, and drives scientific discovery.
Overview of Anscombe’s Quartet and its implications
Anscombe’s Quartet is a group of four datasets that have nearly identical simple descriptive statistics, including means, variances, correlations, and linear regression lines, but are actually very different when graphed. It was created by the statistician Francis Anscombe in 1973 to demonstrate the importance of visualizing data before analyzing it and to highlight the limitations of relying solely on summary statistics.
The implications of Anscombe’s Quartet are significant:
- Importance of visualization: Anscombe’s Quartet illustrates that visualizing data is crucial for understanding its underlying patterns and relationships. Summary statistics alone may not reveal the true nature of the data.
- Dangers of relying on summary statistics: While summary statistics like means, variances, and correlations provide useful information, they can be misleading if used in isolation. Anscombe’s Quartet shows that datasets with very different distributions can have similar summary statistics.
- Need for exploratory data analysis: Anscombe’s Quartet highlights the importance of exploratory data analysis (EDA) techniques, such as data visualization and data transformation, to gain insights into the data before performing more complex analyses.
- Relevance to regression analysis: The quartet demonstrates that linear regression analysis should not be conducted without first visualizing the data, as the relationship between variables may not be linear even if the correlation coefficient suggests otherwise.
- Educational tool: Anscombe’s Quartet is often used as an educational tool in statistics to emphasize the importance of data visualization and the limitations of summary statistics. It encourages students and researchers to think critically about their data and analysis methods.
In summary, Anscombe’s Quartet serves as a reminder that data analysis should not rely solely on summary statistics, and that visualizing data is essential for gaining a true understanding of its characteristics and relationships.
Base Plotting in R
Understanding the basics of base graphics
Base graphics in R refer to the traditional plotting system that comes built-in with the R language. These functions provide a simple and effective way to create a wide variety of plots and visualizations. Here are some basics of base graphics in R:
- Plotting functions: The primary function for creating plots in base graphics is
plot(). It can be used to create scatter plots, line plots, bar plots, histograms, and more. For example,plot(x, y)creates a scatter plot ofyagainstx. - Customization: Base graphics allow for a high degree of customization. You can change the type of plot (e.g., points, lines, bars), colors, axes labels, titles, and more using various parameters in the plotting functions.
- Adding to plots: You can add elements to existing plots using functions like
points(),lines(),abline(),text(), andlegend(). These functions allow you to overlay multiple datasets or annotations on a single plot. - Multiple plots: Base graphics support creating multiple plots in a single graphics device (e.g., a window or file) using functions like
par()to set parameters andlayout()to arrange plots in a grid. - Saving plots: You can save plots created with base graphics to various file formats (e.g., PNG, PDF) using functions like
png(),pdf(), anddev.off(). - Coordinate systems: Base graphics use a coordinate system where
(0,0)is at the bottom-left corner of the plotting area. You can customize the axis limits, tick marks, and labels using functions likexlim(),ylim(),axis(), andmtext(). - Examples: Here’s a simple example of creating a scatter plot with base graphics:R
# Generate some example data
 x <- 1:10
 y <- x^2# Create a scatter plot
 plot(x, y, main = "Scatter Plot", xlab = "X-axis", ylab = "Y-axis", col = "blue", pch = 16)
This code creates a scatter plot of
yagainstxwith a blue color and solid circular points (pch = 16). Themain,xlab, andylabarguments are used to add a title and axis labels to the plot.
Creating scatter plots, line plots, and bar charts
To create scatter plots, line plots, and bar charts using base graphics in R, you can use the plot(), lines(), barplot(), and other related functions. Here are examples of how to create each type of plot:
- Scatter plot:
# Generate some example data
 x <- 1:10
 y <- x^2# Create a scatter plot
 plot(x, y, main = "Scatter Plot", xlab = "X-axis", ylab = "Y-axis", col = "blue", pch = 16)
- Line plot:
# Generate some example data
 x <- 1:10
 y1 <- x^2
 y2 <- x^1.5# Create a line plot
 plot(x, y1, type = "l", col = "blue", lwd = 2, ylim = c(0, max(y1, y2)),
 main = "Line Plot", xlab = "X-axis", ylab = "Y-axis")
 lines(x, y2, col = "red", lwd = 2, lty = 2) # Add a second line
 legend("topright", legend = c("Y = X^2", "Y = X^1.5"), col = c("blue", "red"), lwd = 2, lty = 1:2)
- Bar chart:
# Generate some example data
 categories <- c("A", "B", "C", "D")
 values <- c(10, 20, 15, 25)# Create a bar chart
 barplot(values, names.arg = categories, col = "skyblue", main = "Bar Chart",
 xlab = "Categories", ylab = "Values")
These examples demonstrate how to create basic plots using base graphics in R. You can further customize these plots by adjusting parameters such as colors, line types, point shapes, and axis labels to suit your needs.
Customizing plots with titles, labels, and legends
Customizing plots with titles, labels, and legends can greatly improve their clarity and interpretability. Here’s how you can customize these aspects in base graphics in R:
- Titles and labels:
- Use the
mainargument to add a title to the plot. - Use the
xlabandylabarguments to add labels to the x-axis and y-axis, respectively.
- Use the
# Example scatter plot with title and labels
 plot(x, y, main = "Scatter Plot", xlab = "X-axis", ylab = "Y-axis", col = "blue", pch = 16)
- Legends:
- Use the
legend()function to add a legend to the plot. Specify the location ("top","bottom","left","right", or coordinates), legend labels, colors, line types, and other parameters. - You can also use the
colandpcharguments in the plotting functions to specify colors and point shapes for individual data series.
- Use the
# Example line plot with legend
 plot(x, y1, type = "l", col = "blue", lwd = 2, ylim = c(0, max(y1, y2)),
 main = "Line Plot", xlab = "X-axis", ylab = "Y-axis")
 lines(x, y2, col = "red", lwd = 2, lty = 2) # Add a second line
 legend("topright", legend = c("Y = X^2", "Y = X^1.5"), col = c("blue", "red"), lwd = 2, lty = 1:2)
These examples show how to customize plots with titles, labels, and legends in base graphics in R. Experiment with different parameters and settings to create visually appealing and informative plots.
Introduction to ggplot2 Package
Understanding the grammar of graphics
The grammar of graphics is a concept introduced by Leland Wilkinson that provides a structured way to think about and create visualizations. It breaks down the process of creating a plot into a set of components that can be combined in different ways to generate a wide variety of visualizations. The grammar of graphics consists of the following components:
- Data: The dataset that contains the information to be visualized. This can be a data frame, matrix, or other data structure.
- Aesthetic mappings: Aesthetic mappings define how variables in the dataset are mapped to visual properties of the plot, such as position, color, size, shape, and transparency. For example, mapping a variable to the x-axis position determines the horizontal placement of points or bars in the plot.
- Geometric objects (geoms): Geometric objects represent the visual elements of the plot, such as points, lines, bars, and areas. Each geom corresponds to a specific type of plot (e.g.,
geom_point()for scatter plots,geom_line()for line plots). - Statistical transformations (stats): Statistical transformations are functions that summarize or transform the data in some way before plotting. For example,
stat_bin()is used to bin continuous data into discrete intervals for creating histograms. - Scales: Scales define how the values of aesthetic mappings are converted into visual properties. For example, a scale might specify that values of a variable ranging from 0 to 100 should be mapped to a color scale ranging from blue to red.
- Coordinate system: The coordinate system defines the space in which the plot is drawn. Common coordinate systems include Cartesian coordinates (x-y plane) and polar coordinates (radial and angular axes).
- Facets: Facets allow you to create multiple plots (panels) based on the levels of one or more variables. This is useful for comparing subsets of data.
By understanding and manipulating these components, you can create a wide range of visualizations tailored to your specific needs. The grammar of graphics provides a flexible and powerful framework for data visualization, implemented in packages like ggplot2 in R and ggplot in Python’s plotnine library.
Creating static plots using ggplot2
Creating static plots using ggplot2 involves following the grammar of graphics principles. Here’s a basic example to create a scatter plot:
- Install and load ggplot2 (if not already installed):
install.packages("ggplot2")
 library(ggplot2)
- Create a dataset (example data):
data <- data.frame(
 x = 1:10,
 y = (1:10)^2
 )
- Create the plot:
# Basic scatter plot
 ggplot(data, aes(x = x, y = y)) +
 geom_point() +
 labs(title = "Scatter Plot", x = "X-axis", y = "Y-axis")
In this example, ggplot() initializes the plot, aes() specifies the aesthetic mappings (x and y axes), geom_point() adds points to the plot, and labs() sets the plot title and axis labels. You can further customize the plot by adding layers (+), changing the theme, adding color scales, and more.
Customizing plots with themes and scales
Customizing plots in ggplot2 with themes and scales allows you to change the overall appearance of the plot, including colors, fonts, gridlines, and more. Here’s how you can use themes and scales to customize a plot:
- Customizing themes:
- Themes control the overall appearance of the plot, including background color, gridlines, axis text, and more.
- Use
theme()function to apply a theme. Some common themes includetheme_bw()(black and white),theme_minimal()(minimalistic), andtheme_void()(no axes or labels).
# Customize the plot theme
 ggplot(data, aes(x = x, y = y)) +
 geom_point() +
 labs(title = "Scatter Plot", x = "X-axis", y = "Y-axis") +
 theme_minimal() # Apply the minimal theme
- Customizing scales:
- Scales control how the data values are mapped to visual properties, such as colors, shapes, and sizes.
- Use
scale_functions (e.g.,scale_color_manual(),scale_shape_manual(),scale_size()) to customize scales.
# Customize the color scale
 ggplot(data, aes(x = x, y = y, color = x)) +
 geom_point() +
 labs(title = "Scatter Plot", x = "X-axis", y = "Y-axis") +
 scale_color_gradient(low = "blue", high = "red") # Use a gradient color scale
These examples demonstrate how to customize plots in ggplot2 using themes and scales. Experiment with different themes, scales, and other customization options to create visually appealing and informative plots.
Visualizing 1D Data
Creating and customizing histograms
Creating and customizing histograms in ggplot2 involves using the geom_histogram() function and various customization options. Here’s a basic example:
- Create a dataset (example data):
data <- data.frame(
 values = rnorm(100, mean = 0, sd = 1)
 )
- Create the histogram:
# Basic histogram
 ggplot(data, aes(x = values)) +
 geom_histogram(binwidth = 0.5, fill = "skyblue", color = "black") +
 labs(title = "Histogram", x = "Values", y = "Frequency")
In this example, geom_histogram() creates the histogram, binwidth specifies the width of the bins, fill sets the fill color of the bars, and color sets the color of the borders of the bars. labs() is used to set the plot title and axis labels.
- Customize the histogram:
# Customized histogram
 ggplot(data, aes(x = values)) +
 geom_histogram(binwidth = 0.5, fill = "skyblue", color = "black") +
 labs(title = "Customized Histogram", x = "Values", y = "Frequency") +
 theme_minimal() + # Apply a minimal theme
 scale_x_continuous(breaks = seq(-3, 3, by = 1), limits = c(-3, 3)) + # Customize x-axis
 scale_y_continuous(labels = scales::comma_format()) + # Format y-axis labels
 theme(axis.text = element_text(size = 12), # Customize text size
 axis.title = element_text(size = 14, face = "bold")) # Customize axis titles
In this customized histogram, we applied a minimal theme, customized the x-axis to show breaks at every integer from -3 to 3, formatted the y-axis labels using scales::comma_format() to add commas as thousand separators, and adjusted the text size and font weight of axis labels and titles using theme().
You can further customize histograms by changing colors, adjusting bin sizes, adding annotations, and more, using the various customization options available in ggplot2.
Constructing box plots for visualizing distributions
Constructing box plots in ggplot2 allows you to visualize the distribution of a dataset, including the median, quartiles, and potential outliers. Here’s how you can create and customize a box plot:
- Create a dataset (example data):
data <- data.frame(
 group = rep(c("A", "B", "C"), each = 50),
 values = c(rnorm(50, mean = 0, sd = 1), rnorm(50, mean = 1, sd = 1.5), rnorm(50, mean = -1, sd = 0.5))
 )
- Create the box plot:
# Basic box plot
 ggplot(data, aes(x = group, y = values, fill = group)) +
 geom_boxplot() +
 labs(title = "Box Plot", x = "Group", y = "Values")
In this example, geom_boxplot() creates the box plot, fill is used to color the boxes based on the groups, and labs() sets the plot title and axis labels.
- Customize the box plot:
# Customized box plot
 ggplot(data, aes(x = group, y = values, fill = group)) +
 geom_boxplot(color = "black", alpha = 0.8) + # Set border color and transparency
 labs(title = "Customized Box Plot", x = "Group", y = "Values") +
 theme_minimal() + # Apply a minimal theme
 scale_fill_manual(values = c("skyblue", "salmon", "lightgreen")) + # Custom fill colors
 theme(axis.text.x = element_text(angle = 45, hjust = 1)) # Rotate x-axis labels
In this customized box plot, we added a black border to the boxes with 80% transparency (alpha = 0.8), applied a minimal theme, used manual fill colors (scale_fill_manual()) for the groups, and rotated the x-axis labels by 45 degrees (theme(axis.text.x = element_text(angle = 45, hjust = 1))).
Box plots are useful for comparing distributions between different groups or categories in your data. Customizing them can help emphasize certain aspects of the data or improve the overall aesthetics of the plot.
Using dot plots and beeswarm plots to show individual data points
Dot plots and beeswarm plots are useful for showing individual data points along with summary statistics such as means or medians. Here’s how you can create these plots using ggplot2:
- Create a dataset (example data):
data <- data.frame(
 group = rep(c("A", "B", "C"), each = 50),
 values = c(rnorm(50, mean = 0, sd = 1), rnorm(50, mean = 1, sd = 1.5), rnorm(50, mean = -1, sd = 0.5))
 )
- Dot plot:
# Dot plot
 ggplot(data, aes(x = group, y = values, color = group)) +
 geom_point(position = "jitter", size = 2.5) +
 labs(title = "Dot Plot", x = "Group", y = "Values") +
 theme_minimal()
In this dot plot, geom_point() is used to create the plot with position = "jitter" to jitter the points along the x-axis to avoid overlap. The size parameter controls the size of the points.
- Beeswarm plot:
# Beeswarm plot
 library(ggbeeswarm)
 ggplot(data, aes(x = group, y = values, color = group)) +
 geom_beeswarm() +
 labs(title = "Beeswarm Plot", x = "Group", y = "Values") +
 theme_minimal()
For the beeswarm plot, you’ll need to install and load the ggbeeswarm package. geom_beeswarm() creates the beeswarm plot, and position = "dodge" can be used to dodge the points within each group.
Both dot plots and beeswarm plots are effective for visualizing individual data points, but beeswarm plots are especially useful for datasets with larger numbers of points, as they arrange the points to minimize overlap. Adjusting the size, alpha, and position parameters can help you customize these plots to suit your needs.
Advanced 1D Visualization
Creating density plots to show data distribution
Creating density plots in ggplot2 allows you to visualize the distribution of data as a smooth curve. Here’s how you can create a density plot:
- Create a dataset (example data):
data <- data.frame(
 values = rnorm(1000, mean = 0, sd = 1)
 )
- Create the density plot:
# Density plot
 ggplot(data, aes(x = values, fill = ..density..)) +
 geom_density(alpha = 0.5, color = "black") +
 labs(title = "Density Plot", x = "Values", y = "Density")
In this example, geom_density() creates the density plot, and fill = ..density.. fills the area under the curve based on the density values. The alpha parameter controls the transparency of the fill color, and color sets the color of the curve.
You can further customize the density plot by adjusting the bandwidth (adjust parameter in geom_density()), changing the fill color, adding a rug plot (geom_rug()), or using different smoothing methods. Density plots are useful for visualizing the distribution of continuous data and can provide insights into the underlying data distribution.
Using ECDF (Empirical Cumulative Distribution Function) plots
Creating ECDF (Empirical Cumulative Distribution Function) plots in ggplot2 allows you to visualize the cumulative distribution of your data. Here’s how you can create an ECDF plot:
- Create a dataset (example data):
data <- data.frame(
 values = rnorm(100, mean = 0, sd = 1)
 )
- Create the ECDF plot:
# ECDF plot
 ggplot(data, aes(x = values)) +
 stat_ecdf(geom = "step", pad = FALSE) +
 labs(title = "ECDF Plot", x = "Values", y = "Cumulative Probability")
In this example, stat_ecdf() computes the empirical cumulative distribution function and geom = "step" specifies that the plot should be displayed as a step function. The pad = FALSE argument removes padding from the plot.
You can customize the ECDF plot further by adjusting the geom parameter (e.g., using "point" for a point-wise representation), adding vertical lines to highlight specific values, or modifying the axis labels and titles. ECDF plots are useful for comparing the distribution of data across different groups or for comparing data against a theoretical distribution.
Case Studies and Applications
![]()
![]()
The purpose of data visualization in R is to:
• Interactively explore and understand data, i.e., exploratory data analysis. R provides a wide range of tools and packages for creating interactive visualizations that allow users to dive deep into the data and uncover insights.
• Present and communicate results effectively, whether as a preliminary analysis or final results. R’s visualization capabilities enable users to create high-quality plots and charts that can be used in reports, presentations, and publications to effectively communicate findings to a wider audience.
Our goals are to:
• Familiarize ourselves with plotting in R using base graphics and ggplot2.
• Understand the concepts behind the grammar of graphics and ggplot2.
• Learn how to visualize data along one, two, or more dimensions.
Plotly is a powerful package in R for creating interactive visualizations. It provides a wide range of functions for creating plots that can be explored and manipulated by users.
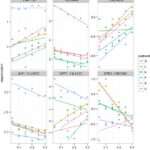
Letʼs use the famous Anscombeʼsʼsʼsʼsʼs quartet data as a motivating example.
Anscombe’s quartet consists of four datasets, each comprising eleven (x, y) points. Despite having nearly identical simple descriptive statistics, these datasets exhibit very different distributions and appear distinct when graphed. Francis Anscombe constructed these datasets in 1973 to illustrate the significance of graphing data during analysis and to showcase the impact of outliers and other influential observations on statistical properties. He aimed to challenge the notion among statisticians that “numerical calculations are exact, but graphs are rough.” This data is composed of 4 pairs of values, (x1, y1) to (x4, y4):
![]()
![]()
![]()
![]()
![]()
![]()
![]()
![]()
![]()
| 10 | 10 | 10 | 8 | 8.04 | 9.14 | 7.46 | 6.58 |
| 8 | 8 | 8 | 8 | 6.95 | 8.14 | 6.77 | 5.76 |
| 13 | 13 | 13 | 8 | 7.58 | 8.74 | 12.74 | 7.71 |
| 9 | 9 | 9 | 8 | 8.81 | 8.77 | 7.11 | 8.84 |
| 11 | 11 | 11 | 8 | 8.33 | 9.26 | 7.81 | 8.47 |
| 14 | 14 | 14 | 8 | 9.96 | 8.10 | 8.84 | 7.04 |
| 6 | 6 | 6 | 8 | 7.24 | 6.13 | 6.08 | 5.25 |
| 4 | 4 | 4 | 19 | 4.26 | 3.10 | 5.39 | 12.50 |
| 12 | 12 | 12 | 8 | 10.84 | 9.13 | 8.15 | 5.56 |
| 7 | 7 | 7 | 8 | 4.82 | 7.26 | 6.42 | 7.91 |
| 5 | 5 | 5 | 8 | 5.68 | 4.74 | 5.73 | 6.89 |
Each of these x and y sets have the same variance, mean and correlation:
![]()
![]()
![]()
![]()
var(x) 11.0000000 11.0000000 11.0000000 11.0000000
| mean(x) | 9.0000000 | 9.0000000 | 9.0000000 | 9.0000000 |
| var(y) | 4.1272691 | 4.1276291 | 4.1226200 | 4.1232491 |
| mean(y) | 7.5009091 | 7.5009091 | 7.5000000 | 7.5009091 |
| cor(x,y) | 0.8164205 | 0.8162365 | 0.8162867 | 0.8165214 |
| But… |
While the residuals of the linear regression clearly indicate fundamental differences in these data, the most simple and straightforward approach in visualisation is to
highlight the fundamental differences in the datasets.

See also another, more recent example: The Datasaurus Dozen dataset.

Throughout this course we will focus on producing visualisations that will enable
![]()
![]() of biomolecular data or the effect of their transformation and analyses. With this in mind, the beauty of the visualisations we will produce wonʼt be assessed by how visually attractive the figures are, but how they advance our understanding the data. In the process of data exploration and data analysis, we want to be able to quickly generate and interpret figures. It is of course important to polish the graphics to make them visually appealing and improve communication with the audience, once a useful figure has been chosen as a means of communication.
of biomolecular data or the effect of their transformation and analyses. With this in mind, the beauty of the visualisations we will produce wonʼt be assessed by how visually attractive the figures are, but how they advance our understanding the data. In the process of data exploration and data analysis, we want to be able to quickly generate and interpret figures. It is of course important to polish the graphics to make them visually appealing and improve communication with the audience, once a useful figure has been chosen as a means of communication.
An important aspect of data visualisation is data ![]()
![]() , transformation and the format of the data and normalisation of the data.
, transformation and the format of the data and normalisation of the data.
A last feature of data that is intimately associated with its manipulation and visualisation is its ![]()
![]() : long and wide dataframes. Some visualisations will be much easier when the data is formatted in a certain way.
: long and wide dataframes. Some visualisations will be much easier when the data is formatted in a certain way.
![]()
![]()
The default graphics system that comes with R, often called base R graphics is simple and fast. It is based on the painterʼs model or canvas, where different output is directly overlaid on top of each other.
Below, we display the relation between the optical density of the deoxyribonuclease (DNase) protein as measure by an enzyme-linked immunosorbent assay (ELISA) assay for all observations.
head(DNase)
| ## | Run | conc | density |
| ## | 1 1 | 0.04882812 | 0.017 |
| ## | 2 1 | 0.04882812 | 0.018 |
| ## | 3 1 | 0.19531250 | 0.121 |
| ## | 4 | 1 | 0.19531250 | 0.124 |
| ## | 5 | 1 | 0.39062500 | 0.206 |
| ## | 6 | 1 | 0.39062500 | 0.215 |
plot(DNase$conc, DNase$density)
Figure 2.1: The default base plot function on the DNase data.

We can add some features on the plot, such vertical dotted lines for all observed observations and customise the look and feel of the plot by setting specific arguments to the plot function.
plot(DNase$conc, DNase$density,
xlab = “DNase concentration (ng/ml)”,
ylab = “Optical
density”,
pch = 1,
col = “steelblue”) abline(v =
unique(DNase$conc), lty = “dotted”)
Figure 2.2: Customising a base figure using function arguments and overlaying new graphical features.

If we wanted to change anything to the figures, we would need to repeat all the commands and modify accordingly. Any additional command would be added to the existing canvas.
How would you produce a figure that differentiates the different runs using base graphics?
Use the hist and boxplot functions to produce a histogram of all optical densities and a boxplot of the densities split by run.
The base graphics function are very effective to quickly produce out of the box figures. However, there is no global overview and parametrisation of the visualisation. The layout decisions have to be made up upfront (and if not adequate, the figure needs to be redrawn) and every aspect of the figure is customised locally as function arguments.
More generally, base graphics functions will work with various inputs: above we have worked with a data.frame, vectors and a formula. There is no unified type of data across all functions which makes it efficient for some types of data (if they match), but also very heterogeneous in terms of interface, leading to a lot of customisation code.
Finally, defaults, and colours in particular, are poorly chosen.
![]()
![]()
![]() ggplot2
ggplot2
ggplot2 is a plotting package that makes it simple to create complex plots from data in a data frame. It provides a more programmatic interface for specifying what variables to plot, how they are displayed, and general visual properties. The theoretical foundation that
supports the ggplot2 is the Grammar of Graphics1. Instead of producing the figure, the user defines and assembles the visual components into an object that is the displayed. There is a book about ggplot22 that provides a good overview, but it is outdated. The ggplot2 web page (https:/:/://ggplololot2.tidyverse..o.o.org) provides ample documentation.
To build a ggplot, we will use the following basic template that can be used for different types of plots:
ggplot(data = <DATA>, mapping = aes(<MAPPINGS>)) + <GEOM_FUNCTION>()
We need first to load the ggplot2 package:
library(“ggplot2”)
![]()
![]() use the ggplot() function and bind the plot to a specific data frame using the data argument
use the ggplot() function and bind the plot to a specific data frame using the data argument
ggplot(data = DNase)
Figure 2.3: We have only specified the data, and thereʼs nothing to display yet.

![]()
![]() define a mapping (using the aesthetic (aes) function), by selecting the variables to be plotted and specifying how to present them in the graph, e.g. as x/y positions or characteristics such as size, shape, colour, etc.
define a mapping (using the aesthetic (aes) function), by selecting the variables to be plotted and specifying how to present them in the graph, e.g. as x/y positions or characteristics such as size, shape, colour, etc.
ggplot(data = DNase,
mapping = aes(x = conc, y = density))
Figure 2.4: ggplot2 can now generate the axes, ticks and ranges based on the data.

![]()
![]() add geoms – graphical representations of the data in the plot (points, lines, bars). To add a geom to the plot use the + operator. Because we have two continuous
add geoms – graphical representations of the data in the plot (points, lines, bars). To add a geom to the plot use the + operator. Because we have two continuous
variables, letʼs use geom_point()
first:
ggplot(data = DNase,
mapping = aes(x = conc, y = density)) +
geom_point()
Figure 2.5: Final figures with rendering of the data as a scatter plot.

Compare the ggplot2 and base graphics version of the density vs. concentration plot. Which one do you prefer, and why?
It is possible to store the output of the ggplot function into a variable that can be visualised by either typing its name in the console or explicitly printing it (like any other variable).
gg <- ggplot(data = DNase,
mapping = aes(x
= conc, y = density)) +
geom_point() print(gg)
Figure 2.6: Saving and printing an object.

Letʼs immediately customise this visualisation to
![]()
![]() highlight how to re-use the gg object without repeating the plotting code and
highlight how to re-use the gg object without repeating the plotting code and
![]()
![]() how we can add additional (identical or different) geoms to a plot.
how we can add additional (identical or different) geoms to a plot.
gg + geom_point(aes(colour =
Run))
Figure 2.7: Adding another geom_point with its own (local) aesthetics.

What do you think of the colours used to differentiate the different runs above?
Finally, we can model easily model and visualise the relation relation between concentration and optical density using a smoothing geom:
conc,
ggplot(data = DNase,
mapping = aes(x =
y =
density)) +
geom_point(aes(colour =
as.character(Run))) +
geom_smooth(method =
“loess”)
## `geom_smooth()` using formula = ‘y ~ x’
Figure 2.9: Modelling the relation between concentration and optical density.

![]()
![]()
Letʼs start by exploring some 1 dimensional visualisation. This is very relevant for omics data such as transcriptomics or quantitative proteomics, when contrasting the expression values
across multiple samples.
We will be using data from the HHiirraagi200133package and describes the cell-to-cell expression variability followed by signal reinforcement progressively segregates early mouse lineages (⊕Ohnishi et al. 2014).
library(“rWSBIM1322”) data(hiiragi2013df1) head(hiiragi2013df1)
| ## | X1426642_at | X1418765_at | X1420085_at | X1418863_at | X1425463_at | X1416967_at | |||||
| ## | 1 | E3.25 | 6.608374 | 11.95630 | 3.027715 | 4.843137 | 5.500618 | 1.731217 | |||
| ## | 2 | E3.25 | 7.385253 | 9.23306 | 9.293016 | 5.530016 | 6.160900 | 9.697038 | |||
| ## | 3 | E3.25 | 5.683255 | 11.24337 | 2.940142 | 4.418059 | 4.584961 | 4.161240 | |||
| ## | 4 | E3.25 | 6.394760 | 10.81817 | 9.715243 | 5.982314 | 4.753439 | 9.540123 | |||
| ## | 5 | E3.25 | 7.874155 | 10.09790 | 8.924228 | 4.923580 | 4.629728 | 8.705340 | |||
| ## | 6 | E3.25 | 6.104932 | 10.39018 | 11.325952 | 4.068520 | 4.165692 | 8.696228 | |||
| ## | File.name | Embryonic.day | Total.number.of.cells | lineage | genotype | ||||||
| ## | 1 | E3.25 | 1_C32_IN | E3.25 | 32 | WT | |||||
| ## | 2 | E3.25 | 2_C32_IN | E3.25 | 32 | WT | |||||
| ## | 3 | E3.25 | 3_C32_IN | E3.25 | 32 | WT | |||||
| ## | 4 | E3.25 | 4_C32_IN | E3.25 | 32 | WT | |||||
| ## | 5 | E3.25 | 5_C32_IN | E3.25 | 32 | WT | |||||
| ## | 6 | E3.25 | 6_C32_IN | E3.25 | 32 | WT | |||||
| ## | ScanDate | sampleGroup | sampleColour | ||||||||
| ## | 1 | E3.25 | 2011-03-16 | E3.25 | #CAB2D6 | ||||||
| ## | 2 | E3.25 | 2011-03-16 | E3.25 | #CAB2D6 | ||||||
| ## | 3 | E3.25 | 2011-03-16 | E3.25 | #CAB2D6 | ||||||
| ## | 4 | E3.25 | 2011-03-16 | E3.25 | #CAB2D6 | ||||||
| ## | 5 | E3.25 | 2011-03-16 | E3.25 | #CAB2D6 | ||||||
| ## | 6 | E3.25 | 2011-03-16 | E3.25 | #CAB2D6 | ||||||
First, we convert a microarray gene expression data to a data.frame, fit for some ggplot2 visualisation, focusing on genes Fgf4 (probeset X1420085_at), Gata4 (X1418863_at), Gata6 (X1425463_at) and Sox2 (X1416967_at).
library(“tidyverse”) genes <-
rename(hiiragi2013df1,
X1420085_at, X1418863_at, X1425463_at,
X1416967_at) %>%
Fgf4 = Gata4 = Gata6 = Sox2 =
“gene”,
“expression”, everything())
select(Fgf4, Gata4,
Gata6, Sox2) %>% pivot_longer(names_to =
values_to =
head(genes)
| ## ## | # | A tibble: 6 × 2 gene expression |
| ## | <chr> <dbl> | |
| ## | 1 | Fgf4 3.03 |
| ## | 2 | Gata4 4.84 |
| ## | 3 | Gata6 5.50 |
| ## | 4 | Sox2 1.73 |
| ## | 5 | Fgf4 9.29 |
| ## | 6 | Gata4 5.53 |
![]()
![]()
%>%
genes %>%
filter(gene == “Gata4”)
ggplot(aes(x =
expression)) + geom_histogram()
## `stat_bin()` using `bins = 30`. Pick better value with `binwidth`.
Figure 2.10: Distribution of the Gata4 expression

![]()
![]()
p <- ggplot(genes, aes(x = gene, y = expression, fill = gene))
bxplot <- p + geom_boxplot() bxplot
Figure 2.11: A boxplot of expression values.

Repeat the above figure replacing the boxes by violins using the geom_violin. Which one do you think does a better job?
See this post, The Boxplololot and ititits pitititffallslsls for more detail about boxplots and how to improve them using jitter, violin plots, and information about the sample size.
![]()
![]()
![]()
When the data arenʼt too large, it is also possibly to visualise all points to get a sense of their distribution.
gene)) + “none”)
jtrplot <- p +
geom_jitter(aes(colour = theme(legend.position =
In a dotplot, the position of the points along the y axis is discretised into bins (set as 1/6 below) and the points are then stacked next to each other.
dotplot <- p +
geom_dotplot(binaxis = “y”, binwidth
= 1/6,
stackdir = “center”, stackratio = 0.75,
aes(color = gene)) +
theme(legend.position =
“none”)
The beeswarm algorithms tries to avoid overlapping points: if a point were to overlap an existing point, it is shifted along the x-axis by a small amount sufficient to avoid overlap.
library(“ggbeeswarm”) beeplot <- p +
geom_beeswarm(aes(color = gene)) +
theme(legend.position =
“none”)
library(patchwork)
jtrplot + dotplot + beeplot
Figure 2.13: Showing all expression values using jittering (left), a dotplot (centre) and a beeswarn plot.

![]()
![]()
densplot <- ggplot(genes, aes(x = expression, color = gene)) +
geom_density() +
theme(legend.position =
“none”)
ecdfplot <- ggplot(genes, aes(x = expression, color = gene)) +
stat_ecdf() +
theme(legend.position =
“none”)
densplot + ecdfplot
Figure 2.14: Density and cumulative density functions of expression values.

![]()
![]()
![]()
![]()
![]() makes sense for unimodal distributions (see below).
makes sense for unimodal distributions (see below).
![]()
![]()
![]() requires definition of bins (width, positions) and can create visual artefacts especially if the number of data points is not large.
requires definition of bins (width, positions) and can create visual artefacts especially if the number of data points is not large.
![]()
![]()
![]() requires the choice of bandwidth; obscures the sample size (i.e. the uncertainty of the estimate).
requires the choice of bandwidth; obscures the sample size (i.e. the uncertainty of the estimate).
![]()
![]()
![]() does not have these problems; but is more abstract and interpretation requires more training. Good for reading off quantiles and shifts in location in comparative plots.
does not have these problems; but is more abstract and interpretation requires more training. Good for reading off quantiles and shifts in location in comparative plots.
![]()
![]()
![]() : for up to a few dozens of points, just show the data.
: for up to a few dozens of points, just show the data.
![]()
![]()
![]()
The number of modes of a distribution depends on scale transformation of the data.
sim <- data.frame(x = exp(rnorm(n = 1e5,
mean = sample(c(2, 5), size = 1e5,
replace = TRUE))))
p1 <- ggplot(sim, aes(x)) + geom_histogram(binwidth
= 10, boundary = 0) +
xlim(0, 400) p2 <- ggplot(sim,
aes(log(x))) +
geom_histogram(bins =
30)
p1 + p2
## Warning: Removed 8133 rows containing non-finite values (`stat_bin()`).
Figure 2.15: Histograms of the same data without (left) and with (right) log- transformation.

This also applies to density plots.
![]()
![]()
![]()
data(hiiragi2013df2) head(hiiragi2013df2)
| ## | 59 | E4.5 (PE) | 92 | E4.5 | (FGF4-KO) |
| ## 1415670_at | 9.503289 | 8.359740 | |||
| ## 1415671_at | 11.458339 | 11.175453 | |||
| ## 1415672_at | 6.699087 | 10.885286 | |||
| ## 1415673_at | 6.765473 | 4.957310 | |||
| ## 1415674_a_at | 9.974538 | 8.592410 | |||
| ## 1415675_at | 9.294144 | 6.257513 |
scp <-
ggplot(hiiragi2013df2, E4.5 (PE)`,
E4.5 (FGF4-KO)`))
aes(x = `59
y = `92
scp + geom_point()
Figure 2.16: Scatter plot comparing the expression of a wild-type vs. FGF4 KO.

The over-plotting of the dots stops us from learning anything about the density of the different regions of the plot. Use the alpha parameter to geom_points between 0 (full transparency) to 1 (opaque, default).
scp + geom_density2d(h = 0.5, bins = 60)
Figure 2.18: Focusing on contours rather that individual values.

scp + geom_hex()
Figure 2.19: Local density summaries.

![]()
![]()
![]()
When visualising data along additional dimension, we can parameterise the points by setting their shape, colour, size and transparency, that can be set with point aesthetics such as fill, color (or colour), shape, size and alpha.
A very powerful way to represent data along additional dimensions is facetting,
i.e. producing sub-plots for different subsets of the data. Below, we first re-annotate the data using some regular expressions
p1 <- ggplot(hiiragi2013df1, aes(x = X1426642_at, y = X1418765_at, colour = lineage)) +
geom_point()
p2 <- ggplot(hiiragi2013df1, aes(x = X1426642_at, y =
X1418765_at)) +
geom_point() +
facet_grid( . ~ lineage
)
p1 + p2
Figure 2.20: Different sub-plots for different lineages using colours (left) of facets (right) to distinguish the different lineages.

ggplot(hiiragi2013df1,
aes(x = X1426642_at, y = X1418765_at)) +
geom_point() + facet_grid(
Embryonic.day ~ lineage )
Figure 2.21: Different sub-plots for different lineages and embryonic stages.

Use facets to visualise the distribution of the four Fgf4, Gata4, Gata6 and Sox2 genes in the
genes data using histograms.
![]()
![]()
![]()
scp <-
ggplot(hiiragi2013df2[1:100, ],
aes(x= `59
E4.5 (PE)`, y = `92 E4.5 (FGF4-KO)`))
scp2 <- scp + geom_point()
Once we have stored ggplot object in a variable, we can simply pass it to the
plotly::ggplotly function to generate an interactive figure.
library(“plotly”) ggplotly(scp2)
See https:/:/://plololot.l.l.lylyly/r for examples of interactive graphics online.
![]()
![]()
![]()
Load the barley data that comes with the lattice package (that is already installed on your computer). The data describe the yield from a Minnesota barley trial as a data frame with 120 observations on the following 4 variables.
![]()
![]() yield Yield (averaged across three blocks) in bushels/acre.
yield Yield (averaged across three blocks) in bushels/acre.
![]()
![]() variety Factor with levels Svansota, No. 462, Manchuria, No. 475, Velvet, Peatland, Glabron, No. 457, Wisconsin No. 38 and Trebi.
variety Factor with levels Svansota, No. 462, Manchuria, No. 475, Velvet, Peatland, Glabron, No. 457, Wisconsin No. 38 and Trebi.
![]()
![]() year Factor with levels 1932
year Factor with levels 1932
and 1931.
![]()
![]() site Factor with 6 levels: Grand Rapids, Duluth, University Farm, Morris, Crookston, Waseca.
site Factor with 6 levels: Grand Rapids, Duluth, University Farm, Morris, Crookston, Waseca.
Familiarise yourself with the data
Visualise the yield for each variety on all site in 1932 and 1931 using ggplot2. Try to generate a figure on your own. If you struggle, discuss with your fellow students. If you need additional help, or as a check, execute the code in the barley manual page example.
Can you spot an issue with the data?
Write a function named (gg)plot_probe_sets that takes two probe sets and the hiiragi2013df1 data (from the rWSBIM1322 package) as input and produces a scatterplot. Your function should test if the provided probe sets are valid before producing the plot and inform otherwise. Below are some example outputs.
plot_probe_sets(“X1426642_at”, “X1420085_at”, data = hiiragi2013df1)

ggplot_probe_sets(“X1426642_at”, “X1420085_at”, data = hiiragi2013df1)

try(plot_probe_sets(“X1416967_at” “123_at”))
## Error in plot_probe_sets(“X1416967_at”, “123_at”) : ## y %in% colnames(hiiragi2013df1)[1:6] is not TRUE
Related posts:
![AI-computer]()
Essential Tips to Kickstart Your R Learning Journey
bioinformatics![A-RNA-sequence-analysis-basics.]()
Step-by-Step Guide: Is My BAM File Sorted?
bioinformatics![Introduction to Health Informatics]()
From Genes to Degrees: Exploring the Interplay of Bioinformatics, Genomics, and Omics in Academic Pa...
bioinformatics![herapeutic Potential of Long Non-coding RNAs]()
Molecular Biology for Computer Scientists
Guides![AI-proteomics-transcriptomics-bioinformatics]()
Which Human Reference Genome Should I Use?
A.I![genomics]()
Genomics: From Genes to Networks - Exploring the Blueprint of Life
bioinformatics![transcriptomics]()
50 common questions asked in transcriptomics
bioinformatics![computerdrugdesign-basics]()
Step-by-Step Guide to Retrieving Allele Frequencies from the 1000 Genomes Project
bioinformatics![Advanced Genome Analysis Using ggplot2]()
Advanced Genome Analysis Using ggplot2
bioinformatics![bioinformatics projects]()
Step-by-Step Guide: Resolving "Out of Disk Space" Issues with Picard Tools
bioinformatics![variantcalling-bioinformatics]()
Limitations in Bioinformatics: A Critical Analysis
bioinformatics![python-bioinformatics]()
Python for Non-Programmers
bioinformatics![herapeutic Potential of Long Non-coding RNAs]()
DNA Compression Algorithms
A.I![Exploring the Future of Bioinformatics: Trending Topics and Research Opportunities]()
Exploring the Future of Bioinformatics: Trending Topics and Research Opportunities
bioinformatics![genomics]()
A Guide to Free and Open-Source Tools for Flow Cytometry, Gene Expression, and Genomics
bioinformatics![Essentialtoolsinfbioinformatics]()
What are some of the challenges and limitations of bioinformatics?
bioinformatics