Introduction to DOT Plot Analysis in Bioinformatics
November 30, 2023I. Introduction to Bioinformatics and Sequence Analysis
A. Brief overview of bioinformatics and its role in biological research:
Bioinformatics is an interdisciplinary field that combines biology, computer science, and information technology to analyze and interpret biological data. It plays a crucial role in managing and extracting valuable information from the vast amount of biological data generated by modern technologies, such as DNA sequencing, gene expression analysis, and structural biology.
Bioinformatics encompasses a range of techniques and tools for organizing, analyzing, and interpreting biological information, with the ultimate goal of gaining insights into various biological processes. It has applications in genomics, proteomics, structural biology, systems biology, and more. Bioinformatics tools help researchers make sense of complex biological data, facilitating a better understanding of living organisms and the mechanisms underlying various diseases.
B. Introduction to DNA, RNA, and protein sequences:
- DNA (Deoxyribonucleic Acid):
- DNA is a molecule that carries genetic instructions used in the development, functioning, growth, and reproduction of all known living organisms.
- It consists of two long chains (double helix) made up of nucleotides, each containing a phosphate group, a sugar molecule (deoxyribose), and one of four nitrogenous bases: adenine (A), thymine (T), cytosine (C), and guanine (G).
- RNA (Ribonucleic Acid):
- RNA is a molecule that plays a crucial role in various biological processes, including protein synthesis.
- It is single-stranded and consists of nucleotides with a phosphate group, a ribose sugar molecule, and one of four nitrogenous bases: adenine (A), uracil (U), cytosine (C), and guanine (G).
- There are different types of RNA, such as messenger RNA (mRNA), transfer RNA (tRNA), and ribosomal RNA (rRNA), each with specific functions.
- Protein Sequences:
- Proteins are large, complex molecules made up of amino acids, and they perform essential functions in cells.
- The sequence of amino acids in a protein determines its structure and function.
- The genetic code in DNA is transcribed into mRNA, which is then translated into a sequence of amino acids, forming a protein.
C. Importance of sequence analysis in understanding biological processes:
- Evolutionary Insights:
- Sequence analysis helps trace the evolutionary relationships between different species by comparing their DNA, RNA, or protein sequences.
- Functional Annotation:
- Understanding the sequence of genes and proteins provides insights into their functions, allowing researchers to annotate and predict the roles of specific sequences.
- Disease Research:
- Sequence analysis is crucial in identifying genetic variations associated with diseases, aiding in the study of genetic factors underlying various conditions.
- Drug Discovery:
- Analyzing biological sequences contributes to the identification of potential drug targets, facilitating the development of new therapeutic interventions.
- Comparative Genomics:
- Comparative sequence analysis enables the comparison of genomes across different organisms, revealing conserved regions and highlighting functional elements.
In summary, bioinformatics and sequence analysis play integral roles in unlocking the mysteries of biology, providing tools to analyze genetic information and unravel the complexities of living organisms at the molecular level.
II. Basics of Sequence Comparison
A. Pairwise sequence alignment:
Pairwise sequence alignment is a fundamental bioinformatics technique used to identify similarities and differences between two biological sequences, such as DNA, RNA, or protein sequences. The alignment helps highlight regions of similarity and divergence, providing insights into evolutionary relationships and functional similarities.
- Algorithm Overview:
- Needleman-Wunsch Algorithm:
- This algorithm performs global sequence alignment, considering the entire length of both sequences.
- It uses dynamic programming to find the optimal alignment based on a scoring system.
- Smith-Waterman Algorithm:
- This algorithm focuses on local sequence alignment, identifying regions of similarity within the sequences.
- It also employs dynamic programming to find the optimal local alignment.
- Needleman-Wunsch Algorithm:
- Scoring Systems:
- The scoring system assigns scores to matches, mismatches, gaps, and other features in the sequence alignment.
- Positive scores are assigned to matches, negative scores to mismatches, and penalties for introducing gaps in the alignment.
B. Multiple sequence alignment:
Multiple sequence alignment extends pairwise alignment to three or more sequences, allowing the identification of conserved regions and evolutionary relationships among multiple sequences.
- Applications:
- Comparative genomics: Identifying conserved elements across species.
- Functional annotation: Understanding the functional significance of conserved regions.
- Phylogenetic analysis: Constructing evolutionary trees based on sequence similarities.
- Algorithms:
- Progressive Alignment (e.g., ClustalW):
- Aligns sequences progressively, starting with the most similar pair and gradually incorporating additional sequences.
- Hierarchical clustering is often used in this approach.
- Iterative Methods (e.g., MUSCLE, MAFFT):
- Iteratively refine the alignment by considering both local and global sequence features.
- These methods often provide more accurate alignments for divergent sequences.
- Progressive Alignment (e.g., ClustalW):
C. Algorithms for sequence alignment:
- Needleman-Wunsch Algorithm:
- Global sequence alignment algorithm that considers the entire length of sequences.
- Dynamic programming is used to find the optimal alignment.
- Smith-Waterman Algorithm:
- Local sequence alignment algorithm that identifies regions of similarity within sequences.
- Also utilizes dynamic programming to find the optimal local alignment.
- BLAST (Basic Local Alignment Search Tool):
- Heuristic algorithm for comparing a query sequence against a database of sequences.
- Employs a series of steps, including word seeding and extension, to rapidly identify locally similar regions.
D. Scoring matrices:
Scoring matrices are used in sequence alignment algorithms to assign scores to matches, mismatches, and gap penalties. Two widely used matrices are BLOSUM (BLOcks SUbstitution Matrix) and PAM (Point Accepted Mutation) matrices.
- BLOSUM (e.g., BLOSUM62):
- Derived from alignments of blocks of conserved regions in protein families.
- Suitable for comparing closely related protein sequences.
- PAM (e.g., PAM250):
- Based on the probability of observed amino acid substitutions in closely related protein sequences.
- Suitable for comparing more distantly related protein sequences.
Understanding these basics of sequence comparison is essential for bioinformaticians and molecular biologists, as these tools and concepts are widely used in various biological analyses and research endeavors.
III. DOT Plot Fundamentals
A. What is a DOT plot?
A DOT plot is a graphical representation used in bioinformatics to visualize the similarity between two biological sequences, typically DNA, RNA, or protein sequences. The plot is constructed by comparing each position in one sequence with every position in the other sequence and marking a point (dot) when identical or similar regions are found. The resulting plot provides a visual representation of repetitive patterns, similarities, and differences between the sequences.
B. Purpose and applications of DOT plots in bioinformatics:
- Sequence Comparison:
- DOT plots are used to compare two sequences and identify regions of similarity or dissimilarity.
- Repeat Detection:
- DOT plots are effective in detecting repetitive elements or patterns within a single sequence.
- Genome Analysis:
- In genomics, DOT plots can be applied to compare entire genomes, helping to identify homologous regions or duplicated segments.
- Identification of Structural Features:
- DOT plots can reveal structural features such as inverted repeats, direct repeats, and palindromic sequences in DNA.
- Evolutionary Studies:
- DOT plots aid in the analysis of evolutionary relationships by visualizing conserved regions among related sequences.
C. Understanding the concept of self-comparison and cross-comparison:
- Self-Comparison:
- In a self-comparison DOT plot, a single sequence is compared against itself.
- Diagonal lines in the plot indicate identical or highly similar regions within the same sequence.
- Cross-Comparison:
- In a cross-comparison DOT plot, two different sequences are compared against each other.
- Diagonal lines still represent identical or similar regions, but off-diagonal features indicate similarities or differences between the two sequences.
D. Identifying patterns and similarities in sequences using DOT plots:
- Diagonal Lines:
- Diagonal lines in a DOT plot represent identical or highly similar regions within the sequence. The steeper the diagonal, the more identical the regions.
- Off-Diagonal Features:
- Off-diagonal features indicate similarities or differences between the sequences.
- Repetitive patterns or structural elements, such as repeats or inverted repeats, may be identified as off-diagonal lines or clusters.
- Gaps and Misalignments:
- Gaps or misalignments in the DOT plot may suggest insertions, deletions, or other structural variations between the sequences.
- Visual Inspection:
- Visual inspection of the DOT plot allows researchers to quickly identify regions of interest and patterns that may require further investigation.
In summary, DOT plots offer a visual and intuitive way to explore the similarities and differences between biological sequences. They are particularly useful in analyzing repetitive elements, identifying conserved regions, and gaining insights into the structural features of DNA, RNA, or protein sequences.
IV. Creating a Basic DOT Plot
A. Selecting sequences for comparison:
- Purpose of Comparison:
- Define the goal of the sequence comparison. Are you looking for repetitive elements, identifying structural features, or comparing the similarity between two sequences?
- Sequence Type:
- Choose the type of sequences to compare (DNA, RNA, or protein) based on your research question.
- Sequence Length:
- Consider the length of the sequences. Longer sequences may require adjustments in parameters for a meaningful DOT plot.
B. Choosing appropriate parameters:
- Window Size:
- The window size determines the length of the segments to be compared. A larger window size may capture broader patterns, while a smaller window size may highlight finer details.
- Threshold:
- The threshold sets the similarity level required to consider a match. Adjust the threshold based on the degree of similarity you want to visualize.
- Step Size:
- The step size determines the increment between each comparison window. A smaller step size increases sensitivity but may lead to more data points in the DOT plot.
- Scoring System:
- Some tools allow customization of scoring systems for matching, mismatching, and gap penalties. Set these parameters based on the characteristics of your sequences.
C. Generating a basic DOT plot:
- Online Tools:
- There are various online tools available for generating DOT plots without programming knowledge. Examples include:
- EMBOSS DOTTER: https://www.sanger.ac.uk/science/tools/dotter
- Gepard: http://www.gepard.bio.net/
- DOTLET: https://www.ncbi.nlm.nih.gov/projects/sutils/dotlet/
- There are various online tools available for generating DOT plots without programming knowledge. Examples include:
- Programming Languages (e.g., Python with Biopython):python
from Bio import SeqIO
 from Bio.SeqUtils import nt_search# Load sequences from a file
 sequence1 = str(SeqIO.read("sequence1.fasta", "fasta").seq)
 sequence2 = str(SeqIO.read("sequence2.fasta", "fasta").seq)# Set parameters
 window_size = 10
 threshold = 7# Generate DOT plot
 dot_plot = nt_search(sequence1, sequence2, window=window_size, threshold=threshold)# Display or save the DOT plot
 import matplotlib.pyplot as plt
 plt.imshow(dot_plot, cmap='Greys', interpolation='none')
 plt.title('DOT Plot')
 plt.xlabel('Sequence 2 Position')
 plt.ylabel('Sequence 1 Position')
 plt.show()
- This example uses Biopython to load sequences from FASTA files, perform a basic nucleotide search, and create a DOT plot using Matplotlib. Adjust window_size and threshold based on your analysis.
Remember to interpret the DOT plot based on the chosen parameters and the characteristics of your sequences. Experiment with different parameter values to optimize the visualization for your specific analysis.
V. Interpreting Basic DOT Plots
A. Identifying diagonal lines and their significance:
- Diagonal Lines:
- Diagonal lines in a DOT plot represent regions in the sequences where there is a high degree of similarity or identity.
- Significance: Diagonal lines indicate conserved or identical segments, suggesting evolutionary conservation or functional importance.
- Steeper Diagonals:
- Steeper diagonals suggest longer identical or highly similar regions.
- Significance: Longer conserved regions may indicate functional domains or shared ancestry.
- Parallel Diagonals:
- Parallel diagonals may indicate repeated patterns or duplications within the sequence.
- Significance: Repeated elements may have functional implications or provide insights into the evolutionary history of the sequence.
B. Recognizing repetitive elements and sequence duplications:
- Off-Diagonal Lines:
- Off-diagonal lines represent repetitive elements or sequence duplications.
- Significance: Repetitive elements can include transposons, tandem repeats, or other duplicated regions with potential functional or structural importance.
- Clusters of Dots Away from Diagonals:
- Clusters of dots away from the diagonals may indicate dispersed repeats or duplicated segments.
- Significance: Identifying these patterns helps in understanding the distribution and arrangement of repetitive elements in the sequence.
- Variable Gap Sizes:
- Variable gap sizes between repeats suggest differences in the length of duplicated elements.
- Significance: Variability in gap sizes may indicate evolutionary divergence or ongoing structural changes in the duplicated regions.
C. Understanding the implications of gaps and mismatches in the DOT plot:
- Gaps in the DOT Plot:
- Mismatched Regions:
- Regions with mismatches in the DOT plot indicate dissimilarity between the sequences.
- Significance: Mismatches may be due to point mutations, sequence divergence, or evolutionary changes, providing insights into the evolutionary dynamics of the sequences.
- Sparse or Missing Dots:
- Sparse or missing dots in certain regions may indicate low similarity between those segments.
- Significance: Regions with sparse dots may represent non-conserved or rapidly evolving regions, potentially associated with functional divergence.
In summary, interpreting DOT plots involves recognizing patterns, understanding the significance of diagonal and off-diagonal features, and considering the implications of gaps and mismatches. DOT plots are valuable tools for visualizing sequence similarities and differences, aiding in the identification of conserved regions, repetitive elements, and structural variations within biological sequences.
VI. Intermediate DOT Plot Analysis
A. Handling larger datasets:
- Subsampling or Sliding Windows:
- For large datasets, consider subsampling or using sliding windows to analyze smaller segments of the sequences at a time.
- This can make the analysis more computationally manageable and provide insights into local similarities.
- Parallel Processing:
- Utilize parallel processing techniques to distribute the workload across multiple processors or cores.
- This can significantly reduce computation time when dealing with large datasets.
B. Advanced parameter tuning for improved sensitivity and specificity:
- Optimizing Window Size and Step Size:
- Experiment with different window sizes and step sizes to find the optimal balance between sensitivity and specificity.
- Larger window sizes may capture broader patterns, while smaller window sizes can detect finer details.
- Threshold Adjustment:
- Fine-tune the similarity threshold to control the stringency of the DOT plot.
- Lowering the threshold increases sensitivity but may also introduce more noise, while raising it may lead to higher specificity but potentially miss relevant features.
- Scoring Matrices:
- Some DOT plot tools allow the use of custom scoring matrices. Experiment with different matrices to better reflect the characteristics of your sequences.
C. Dealing with noisy data and filtering out irrelevant information:
- Smoothing Techniques:
- Apply smoothing techniques to reduce noise in the DOT plot. This can involve averaging neighboring data points to enhance the visibility of patterns.
- Filtering Algorithms:
- Implement filtering algorithms to remove low-significance data points, emphasizing only the most relevant features.
- Consider using statistical methods to identify significant features.
- Post-Processing:
- After generating the initial DOT plot, perform post-processing to refine the visualization. This may involve manual curation or automated methods to filter out less informative regions.
D. Practical tips for efficient DOT plot analysis:
- Normalization:
- Normalize the data to account for variations in sequence lengths. Normalization ensures that patterns are not biased by differences in the overall sequence sizes.
- Interactive Tools:
- Use interactive DOT plot tools that allow zooming, panning, and real-time adjustments. This enables efficient exploration and analysis of specific regions of interest.
- Combine with Additional Analyses:
- Integrate DOT plot analysis with other bioinformatics tools and analyses, such as multiple sequence alignment or motif discovery, to gain a more comprehensive understanding of the biological implications.
- Documentation:
- Keep detailed documentation of the analysis steps, including parameter settings and any pre-processing or filtering applied. This facilitates reproducibility and sharing of results.
- Iterative Approach:
- Perform an iterative analysis by adjusting parameters based on initial findings. This allows for refinement of the analysis and a more targeted exploration of specific sequence features.
By considering these strategies, researchers can conduct more sophisticated DOT plot analyses, especially when dealing with larger datasets or when aiming for a balance between sensitivity and specificity in identifying sequence similarities and structural features.
VII. Real Case Study: Genome Rearrangement Analysis
A. Introduction to genome rearrangements:
- Definition:
- Genome rearrangements refer to large-scale structural changes in the order or orientation of DNA sequences within a genome.
- Types of Rearrangements:
- Inversions: Reversals of the order of genes or genomic segments.
- Translocations: Movement of genomic segments from one location to another.
- Duplications: Copying of genomic segments.
- Deletions: Removal of genomic segments.
- Biological Significance:
- Genome rearrangements can have profound effects on an organism’s phenotype, influencing traits, adaptation, and disease susceptibility.
B. Selecting genomes for comparison:
- Comparing Related Species:
- Choose genomes of related species or strains to study evolutionary changes and divergence.
- Pathogenic vs. Non-pathogenic Strains:
- Compare genomes of pathogenic and non-pathogenic strains to understand the genetic basis of virulence.
- Close vs. Distant Relatives:
- Consider comparing genomes of organisms with varying degrees of relatedness to study the impact of evolutionary distance on genome rearrangements.
C. Generating DOT plots to identify rearrangements:
- Tool Selection:
- Choose a suitable tool for genome comparison that allows for the generation of DOT plots. Tools like Mauve, Nucmer (part of the MUMmer suite), or other alignment tools capable of producing DOT plots are often used.
- Genome Alignment:
- Align the selected genomes using the chosen tool. This may involve setting parameters specific to genome rearrangement analysis.
- DOT Plot Generation:
- Generate DOT plots from the alignment results. DOT plots will reveal patterns of synteny (conserved gene order) and identify regions where rearrangements have occurred.
D. Analyzing the results and drawing biological conclusions:
- Identifying Rearrangement Patterns:
- Diagonal lines in the DOT plot indicate conserved regions, while off-diagonal lines suggest rearrangements.
- Analyze the patterns of off-diagonal lines to identify the type and scale of rearrangements (inversions, translocations, etc.).
- Validation and Refinement:
- Validate the identified rearrangements using additional analyses or experimental data.
- Refine the analysis by adjusting parameters, such as the similarity threshold or the size of the sliding window.
- Biological Inferences:
- Relate identified rearrangements to biological phenomena, such as adaptation, speciation, or pathogenicity.
- Investigate the genes within rearranged regions for potential functional implications.
- Comparative Genomics:
- Perform additional analyses, such as gene content comparisons or functional annotations, to complement the genome rearrangement analysis.
- Compare the results with existing knowledge of the biology of the studied organisms.
- Publication and Communication:
- Communicate the findings through scientific publications, presentations, or databases to contribute to the broader understanding of genome rearrangements in the studied organisms.
This case study illustrates how DOT plots, in conjunction with genome rearrangement analysis tools, can be applied to explore structural variations in genomes and draw meaningful biological conclusions. The process involves careful selection of genomes, execution of genome comparisons, and interpretation of DOT plots to uncover the dynamics of genome rearrangements and their implications in different biological contexts.
VIII. Advanced DOT Plot Applications
A. Comparative genomics using DOT plots:
- Evolutionary Studies:
- Use DOT plots for comparative genomics to visualize conserved regions and rearrangements among multiple genomes.
- Identify shared synteny and study the evolution of gene order and content across different species.
- Phylogenetic Analysis:
- Combine DOT plots with phylogenetic analysis to understand the evolutionary relationships between species.
- Compare DOT plot patterns with phylogenetic trees to infer the impact of genome rearrangements on evolutionary divergence.
- Genome Annotation:
- Integrate DOT plots with genome annotation data to correlate rearrangements with annotated features such as genes, regulatory elements, and functional domains.
- Explore the relationship between genomic organization and functional elements.
B. DOT plot analysis for functional annotation:
- Functional Domain Mapping:
- Overlay DOT plots with information on functional domains to identify whether rearrangements coincide with changes in gene function.
- Explore the correlation between conserved synteny and conserved functional domains.
- Gene Ontology Analysis:
- Integrate DOT plots with Gene Ontology (GO) annotations to study the functional implications of rearrangements.
- Analyze how changes in genomic organization relate to functional categories and biological processes.
- Pathway Enrichment:
- Use DOT plots to identify regions associated with pathways of interest.
- Correlate genome rearrangements with changes in metabolic pathways or signaling cascades.
C. Integrating DOT plots with other bioinformatics tools and analyses:
- Multiple Sequence Alignment:
- Combine DOT plots with multiple sequence alignment to gain a comprehensive view of sequence conservation and rearrangements.
- Identify conserved regions at both the nucleotide and amino acid levels.
- Motif Discovery:
- Integrate DOT plots with motif discovery tools to identify conserved regulatory motifs within rearranged regions.
- Explore how changes in genomic organization may impact the regulation of genes.
- Structural Variant Analysis:
- Integrate DOT plots with structural variant analysis tools to identify large-scale genomic alterations, such as insertions, deletions, and duplications.
- Analyze the intersection between structural variants and rearrangements identified in DOT plots.
- Population Genomics:
- Extend DOT plot analyses to population-level genomics by comparing multiple individuals within a species.
- Investigate the variability in genome rearrangements across different populations.
- Machine Learning Approaches:
- Apply machine learning approaches to classify and predict the functional consequences of observed rearrangements.
- Train models using features derived from DOT plots and additional genomic information.
By incorporating DOT plots into advanced applications such as comparative genomics, functional annotation, and integration with diverse bioinformatics tools, researchers can extract more nuanced insights into the biological implications of genome rearrangements. These integrative approaches enhance our understanding of the relationships between genomic organization and functional elements in various biological contexts.
IX. Future Directions in DOT Plot Analysis
A. Emerging trends and technologies in sequence analysis:
- Single-Cell Sequencing:
- Explore the application of DOT plots in single-cell sequencing data, considering the unique challenges and opportunities presented by this emerging technology.
- Long-Read Sequencing Technologies:
- Assess how DOT plots can be adapted for the analysis of long-read sequencing data, such as those generated by technologies like PacBio and Oxford Nanopore.
- Integrative Multi-Omics Analysis:
- Investigate the integration of DOT plots with other omics data, such as transcriptomics, epigenomics, and proteomics, to provide a holistic view of biological systems.
- Metagenomics and Microbial Communities:
- Explore the use of DOT plots in comparing and analyzing genomes within microbial communities, considering the challenges posed by metagenomic datasets.
B. Challenges and opportunities in DOT plot analysis:
- Computational Efficiency:
- Address challenges related to the computational efficiency of DOT plot analysis, especially when dealing with large-scale datasets or complex genomic arrangements.
- Automated Pattern Recognition:
- Explore opportunities for developing automated pattern recognition algorithms to assist in the identification and classification of complex patterns in DOT plots.
- Interactivity and Visualization Tools:
- Develop more interactive and user-friendly visualization tools for DOT plot analysis, allowing researchers to explore and interpret results more efficiently.
- Statistical Significance:
- Enhance methods for assessing the statistical significance of observed patterns in DOT plots, providing a more robust framework for result interpretation.
C. Resources for staying updated and further learning:
- Research Journals:
- Regularly check publications in bioinformatics and genomics journals for the latest advancements in sequence analysis and DOT plot applications.
- Conferences and Workshops:
- Attend conferences, workshops, and webinars focused on bioinformatics, genomics, and computational biology to stay informed about emerging trends and technologies.
- Online Courses and Tutorials:
- Enroll in online courses and tutorials that cover advanced topics in sequence analysis, comparative genomics, and DOT plot applications.
- Community Forums:
- Join online forums and communities dedicated to bioinformatics and genomics to engage in discussions, share experiences, and seek advice from fellow researchers.
Related posts:
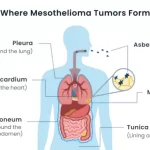
![where-mesothelioma-tumors-form-genome]()
Mesothelioma: A Bioinformatics Perspective on Diagnosis, Prognosis, and Treatment
bioinformatics![computer-bioinformatics-chatgpt-claude]()
Cracking the Code of Life: How Computing Became the Game-Changer for Bioinformatics
bioinformatics![A futuristic bioinformatics laboratory]()
The Future of Life: Bioinformatic Innovations Shaping the World of Tomorrow
bioinformatics![C:\Users\User\Desktop\blog\bioinfotuts]()
What Drives Personalized Medicine in Bioinformatics?
bioinformatics![Spatial Metabolomics]()
Challenges in Metabolomics Bioinformatics
bioinformatics![conference2024]()
10 Reasons Why Attending Conferences Benefits Students
bioinformatics![Time Wastage In Bioinformatics Analysis]()
Step-by-Step Guide: Avoiding Wasted Time in Bioinformatics Analysis
bioinformatics![bioinformatics-fileformat-basics]()
Step-by-Step Guide to Download Raw Sequence Data from GEO/SRA
bioinformatics![remotecomputer-bioinformatics]()
Bioinformatics on Windows: Exploring Its Role and Evolving Trends
bioinformatics![AI-computer]()
How To Analyze Imputed GWAS Data
bioinformatics![Detection rate by SDG and model: OpenAI GPT-3.5 (prescribed description) vs. specialized model.]()
Microbiome Engineering: Targeted Manipulation of Microbial Communities
bioinformatics![Bioinformatics related Organizations and Associations]()
Bioinformatics related Organizations and Associations
bioinformatics![Quantum_Computing_bioinformatics-omicstutorials]()
Quantum Computing Promises to Overhaul Computational Drug Discovery
bioinformatics![Bioinformatics]()
How to Use Bioinformatics Databases and Tools to Accelerate Your Research
bioinformatics![genomics]()
Genomics: From Genes to Networks - Exploring the Blueprint of Life
bioinformatics![remotecomputer-bioinformatics]()
Step-By-Step Docker Installation on Windows and Linux
bioinformatics