Cell Biology Fundamentals for Bioinformatics
March 27, 2024 Off By adminTable of Contents
ToggleCourse Description:
This course provides an introduction to cell biology concepts essential for understanding biological data used in bioinformatics. Students will learn about cell structure, function, and molecular processes, with a focus on their relevance to bioinformatics analysis.
Prerequisites:
Basic knowledge of biology and bioinformatics.
Course Objectives:
- Understand the structure and function of eukaryotic and prokaryotic cells.
- Learn about cellular processes such as DNA replication, transcription, translation, and cell signaling.
- Gain knowledge of how cellular processes are represented in bioinformatics data.
- Develop basic bioinformatics skills to analyze and interpret cell biology data.
Introduction to Cell Biology
Overview of cell theory
Cell theory is a fundamental principle in biology that describes the properties of cells, the basic structural and functional units of all living organisms. The theory has three main components:
- All living organisms are composed of one or more cells: This statement asserts that cells are the building blocks of life and that all living things, from single-celled bacteria to complex multicellular organisms like plants and animals, are made up of cells.
- The cell is the basic unit of life: This component of the theory emphasizes the importance of cells as the smallest unit of life. Cells perform all the functions necessary for life, such as metabolism, growth, and reproduction.
- Cells arise from pre-existing cells: This part of the theory states that new cells are formed by the division of pre-existing cells. This concept was first proposed by Rudolf Virchow in the 19th century, who famously stated, “Omnis cellula e cellula” (All cells arise from cells).
Definition
A postulated and widely accepted hypothesis of how most life on Earth operates is known as the “cell theory.” The hypothesis states that cells comprise all organisms. Organs, tissues, and organisms are made up of groups of cells. These are the fundamental assumptions of cell theory.
The modern iteration of the cell theory consists of the following concepts:
- Energy moves through cells.
- DNA is transferred from cell to cell, carrying genetic information.
- All cells share the same primary chemical makeup.
In addition to cell theory, the fundamental precepts that serve as the basis for studying life include evolution, homeostasis, gene theory, and the laws of thermodynamics.
History and Contributions
Magnification technology progressed to the point that it could be used to find cells due to ongoing advances in microscopes. Robert Hooke is usually credited with making this discovery, which launched cell biology as a field of study. Under the scope, he could discern pores in a piece of cork.
Schleiden and Schwann first proposed the cell theory, which was later modified by Rudolf Virchow. Since the discovery of the first cells, cell theory has evolved and grown, and many amazing experiments have been designed to demonstrate its many components.
Parts of Cell Theory
There are three main postulates of cell theory are as follows:
- First, cells make up all living things.
- Second, cells are the basic building blocks for developing tissues, organs, and fully developed living creatures.
- The third, and maybe most crucial, aspect of the hypothesis is that cells can only develop from other cells.
Thus, all living things begin as individual cells. These cells multiply, divide through mitosis, and eventually form multicellular organisms. Mitosis is a type of cell division that yields identical cells. When mixed signals are applied to these cells, they can differentiate to form various tissues and organs. This is the process used to produce enormous, complex organisms. However, when a single-celled organism divides, the cells split into two new organisms. This process of reproduction is asexual.
Cell Types
Prokaryotes
Prokaryotes are generally small cells that are enclosed by the plasma membrane. Depending on the species, they have a distinctive cell wall, varying in composition. Prokaryotes do not contain a nucleus and membrane-bound organelles. They possess circular or linear DNA. The chromosomal area and the cytoplasm are found in the protoplasm of prokaryotes. Prokaryotes are divided into two domains: archaea and bacteria.
Eukaryotes
Eukaryotic cells have a nucleus, organelles, and a plasma membrane surrounding them. Eukaryotic cells evolved particular organelles, parts of the cell that have a specific function. These organelles include the endoplasmic reticulum, which sorts and bundles proteins; the mitochondria, which provide energy; and chloroplasts, found in plants and produce food from sunlight and carbon dioxide.
Single-celled Organisms
Cell theory can be well understood by looking at single-celled species. Modern microscopes made it simple to observe and study cell theory mechanisms. Placing a drop of pond water under a microscope provides an excellent opportunity to observe the application of the cell theory.
Plants
Cells were first observed in plants. Plants may maintain their rigidity because of the sizeable cell walls. The first person to identify cells was Robert Hooke, who used a simple microscope focused on a thin cork slice. He assumed that the structures were exclusive to plant tissues. Cell theory was not widely recognised by science until the 1840s.
Animals
Scientist Theodor Schwann produced evidence in 1839 demonstrating that animals were made up of several cell types. Compared to earlier scientists, modern microscopy techniques give scientists a more complete and accurate image of cells.
Every cell in the human body is a different type of cell. According to cell theory, each of these cells originated from the zygote, a single cell produced upon the fertilisation of an egg by a sperm. Then, this cell multiplies, divides, and starts differentiating into the various types of cells that make up the human body. A fully developed organism is eventually formed.
Comparison of prokaryotic and eukaryotic cells
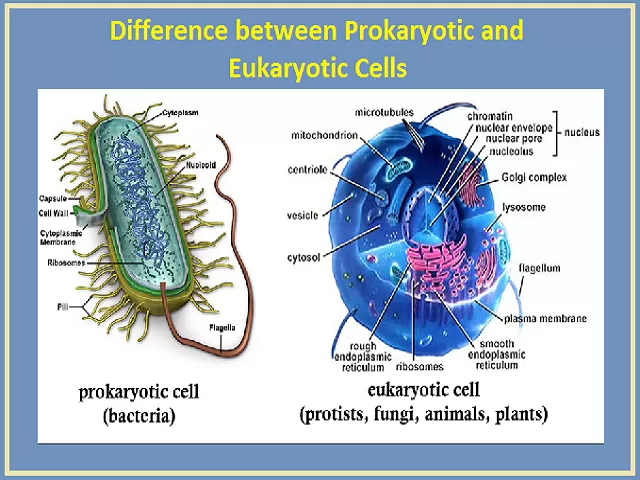
Anatomically, cells vary with respect to their classification, therefore, prokaryotic cells and eukaryotic cells differ from each other quite drastically. Read on to explore how they differ from each other.
Prokaryotic Cell
The term “prokaryote” is derived from the Greek word “pro“, (meaning: before) and “karyon” (meaning: kernel). It translates to “before nuclei.“
Prokaryotes are one of the most ancient groups of living organisms on earth, with fossil records dating back to almost 3.5 billion years ago.
These prokaryotes thrived in the earth’s ancient environment, some using up chemical energy and others using the sun’s energy. These extremophiles thrived for millions of years, evolving and adapting. Scientists speculate that these organisms gave rise to the eukaryotes.
Prokaryotic cells are comparatively smaller and much simpler than eukaryotic cells. The other defining characteristic of prokaryotic cells is that it does not possess membrane-bound cell organelles such as a nucleus. Reproduction happens through the process of binary fission.
Structurally, prokaryotes have a capsule enveloping their entire body, and it functions as a protective coat. This is crucial for preventing the process of phagocytosis (where the bacteria gets engulfed by other eukaryotic cells, such as macrophages) The pilus is a hair-like appendage found on the external surface of most prokaryotes and it helps the organism to attach itself to various environments. The pilus essentially resists being flushed, hence, it is also called attachment pili. It is commonly observed in bacteria.
Right below the protective coating lies the cell wall, which provides strength and rigidity to the cell. Further down lies the cytoplasm that helps in cellular growth, and this is contained within the plasma membrane, which separates the interior contents of the cell from the outside environment. Within the cytoplasm, ribosomes exist and it plays an important role in protein synthesis. It is also one of the smallest components within the cell.
Some prokaryotic cells contain special structures called mesosomes which assist in cellular respiration. Most prokaryotes also contain plasmids, which contain small, circular pieces of DNA. To help with locomotion, flagella are present, though, pilus can also serve as an aid for locomotion. Common examples of Prokaryotic organisms are bacteria and archaea. Also, all members of Kingdom Monera are prokaryotes.
Eukaryotic Cell
The term “Eukaryotes” is derived from the Greek word “eu“, (meaning: good) and “karyon” (meaning: kernel), therefore, translating to “good or true nuclei.” Eukaryotes are more complex and much larger than prokaryotes. They include almost all the major kingdoms except kingdom monera.
Structurally, eukaryotes possess a cell wall, which supports and protects the plasma membrane. The cell is surrounded by the plasma membrane and it controls the entry and exit of certain substances.
The nucleus contains DNA, which is responsible for storing all genetic information. The nucleus is surrounded by the nuclear membrane. Within the nucleus exists the nucleolus, and it plays a crucial role in synthesising proteins. Eukaryotic cells also contain mitochondria, which are responsible for the creation of energy, which is then utilized by the cell.
Present in only plant cells, chloroplasts are the subcellular sites of photosynthesis. The endoplasmic reticulum helps in the transportation of materials. Besides these, there are also other cell organelles that perform various other functions and these include ribosomes, lysosomes, Golgi bodies, cytoplasm, chromosomes, vacuoles and centrosomes.
Examples of eukaryotes include almost every unicellular organism with a nucleus and all multicellular organisms.
Difference between Prokaryotic and Eukaryotic Cells
Though these two classes of cells are quite different, they do possess some common characteristics. For instance, both possess cell membranes and ribosomes, but the similarities end there. The complete list of differences between prokaryotic and eukaryotic cells is summarized as follows:
| Prokaryotes | Eukaryotes | |
| Type of Cell | Always unicellular | Unicellular and multi-cellular |
| Cell size | Ranges in size from 0.2 μm – 2.0 μm in diameter | Size ranges from 10 μm – 100 μm in diameter |
| Cell wall | Usually present; chemically complex in nature | When present, chemically simple in nature |
| Nucleus | Absent. Instead, they have a nucleoid region in the cell | Present |
| Ribosomes | Present. Smaller in size and spherical in shape | Present. Comparatively larger in size and linear in shape |
| DNA arrangement | Circular | Linear |
| Mitochondria | Absent | Present |
| Cytoplasm | Present, but cell organelles absent | Present, cell organelles present |
| Endoplasmic reticulum | Absent | Present |
| Plasmids | Present | Very rarely found in eukaryotes |
| Ribosome | Small ribosomes | Large ribosomes |
| Lysosome | Lysosomes and centrosomes are absent | Lysosomes and centrosomes are present |
| Cell division | Through binary fission | Through mitosis |
| Flagella | The flagella are smaller in size | The flagella are larger in size |
| Reproduction | Asexual | Both asexual and sexual |
| Example | Bacteria and Archaea | Plant and Animal cell |
Cell structure and organelles
Cell structure refers to the organization of components within a cell, including organelles, cytoplasm, and the cell membrane. Organelles are specialized structures within a cell that perform specific functions necessary for the cell’s survival and reproduction. Here is an overview of the main organelles found in eukaryotic cells:
- Nucleus:
- The nucleus is the control center of the cell and contains the cell’s genetic material (DNA).
- It is surrounded by a double membrane called the nuclear envelope, which contains pores that regulate the movement of materials into and out of the nucleus.
- The nucleolus, located within the nucleus, is where ribosomal RNA (rRNA) is synthesized and ribosome assembly begins.
- Mitochondria:
- Mitochondria are often called the “powerhouses” of the cell because they generate the majority of the cell’s adenosine triphosphate (ATP), which is used as a source of energy.
- They have a double membrane structure, with an outer membrane and a highly folded inner membrane called cristae.
- Mitochondria contain their own DNA (mitochondrial DNA or mtDNA) and can replicate independently of the cell.
- Endoplasmic Reticulum (ER):
- The endoplasmic reticulum is a network of membranes that is involved in protein and lipid synthesis, as well as the transport of materials within the cell.
- There are two types of ER: rough ER, which has ribosomes attached to its surface and is involved in protein synthesis, and smooth ER, which lacks ribosomes and is involved in lipid synthesis and detoxification.
- Golgi Apparatus:
- The Golgi apparatus is responsible for modifying, sorting, and packaging proteins and lipids for transport to their final destinations.
- It consists of a series of flattened membrane-bound sacs called cisternae.
- Lysosomes:
- Lysosomes are membrane-bound organelles that contain digestive enzymes responsible for breaking down waste materials, cellular debris, and foreign invaders such as bacteria.
- Peroxisomes:
- Peroxisomes are involved in various metabolic processes, including the breakdown of fatty acids and the detoxification of harmful substances such as hydrogen peroxide.
- They contain enzymes called peroxidases and catalases.
- Cytoskeleton:
- The cytoskeleton is a network of protein filaments that provides structural support to the cell and helps maintain its shape.
- It is involved in cell movement, intracellular transport, and cell division.
- The main components of the cytoskeleton are microtubules, microfilaments, and intermediate filaments.
- Cell Membrane:
- The cell membrane, also known as the plasma membrane, surrounds the cell and regulates the movement of substances into and out of the cell.
- It is composed of a phospholipid bilayer with embedded proteins and cholesterol molecules.
These organelles work together to ensure the proper functioning of the cell and are essential for its survival. Each organelle has specific roles and functions that contribute to the overall health and viability of the cell.

Exercise: Labeling cell structures and organelles in a diagram
Cell Size
At 0.1 to 5.0 μm in diameter, prokaryotic cells are significantly smaller than eukaryotic cells, which have diameters ranging from 10 to 100 μm. The small size of prokaryotes allows ions and organic molecules that enter them to quickly diffuse to other parts of the cell. Similarly, any wastes produced within a prokaryotic cell can quickly diffuse out. This is not the case in eukaryotic cells, which have developed different structural adaptations to enhance intracellular transport.
Small size, in general, is necessary for all cells, whether prokaryotic or eukaryotic. Let’s examine why that is so. First, we’ll consider the area and volume of a typical cell. Not all cells are spherical in shape, but most tend to approximate a sphere. You may remember from your high school geometry course that the formula for the surface area of a sphere is 4πr2, while the formula for its volume is 4/3πr3. Thus, as the radius of a cell increases, its surface area increases as the square of its radius, but its volume increases as the cube of its radius (much more rapidly). Therefore, as a cell increases in size, its surface area-to-volume ratio decreases. This same principle would apply if the cell had the shape of a cube. If the cell grows too large, the plasma membrane will not have sufficient surface area to support the rate of diffusion required for the increased volume. In other words, as a cell grows, it becomes less efficient. One way to become more efficient is to divide; another way is to develop organelles that perform specific tasks. These adaptations led to the development of more sophisticated cells called eukaryotic cells.
Cellular Processes
DNA replication
DNA replication, also known as semi-conservative replication, is the process by which DNA is doubled. This is an important process taking place within the dividing cell.
In this article, we shall discuss the structure of DNA, the steps involved in DNA replication (initiation, elongation and termination) and the clinical consequences that can occur when this process goes wrong.
DNA Structure
DNA is made up of millions of nucleotides. These are molecules composed of a deoxyribose sugar, with a phosphate and a base (or nucleobase) attached to it. These nucleotides are attached to each other in strands via phosphodiester bonds to form a ‘sugar-phosphate backbone’. The bond formed is between the third carbon atom on the deoxyribose sugar of one nucleotide (known as the 3’) and the fifth carbon atom of another sugar on the next nucleotide (known as the 5’).
N.B: 3′ is pronounced ‘three prime’ and 5′ is pronounced ‘five prime’.
There are two strands of DNA, which run in opposite (antiparallel) directions to each other. These strands are attached to each other throughout their lengths via the bases on each nucleotide.
There are 4 different bases associated with DNA: Cytosine, Guanine, Adenine, and Thymine. In normal DNA strands, cytosine binds to guanine, and adenine binds to thymine. When bound together, the two strands form a double helix structure.

The Structure of RNA and DNA
Stages of DNA replication
DNA replication can be thought of in three stages: initiation, elongation and termination
Initiation
DNA synthesis is initiated at particular points within the DNA strand known as ‘origins’, which have specific coding regions. These origins are targeted by initiator proteins, which go on to recruit more proteins that help aid the replication process, forming a replication complex around the DNA origin. Multiple origin sites exist within the DNA’s structure; when replication of DNA begins, these sites are referred to as replication forks.
Within the replication complex is the DNA helicase. This enzyme unwinds the double helix and exposes each of the two strands so that they can be used as a template for replication. It does this by hydrolysing the ATP used to form the bonds between the nucleobases, thereby breaking the bond holding the two strands together.
DNA primase is another enzyme that is important in DNA replication. It synthesises a small RNA primer, which acts as a ‘kick-starter’ for DNA polymerase. This enzyme is ultimately responsible for the creation and expansion of new strands of DNA.
Elongation
Once DNA Polymerase has attached to the two unzipped strands of DNA (i.e. the template strands), it is able to start synthesising new strands of DNA to match the templates. DNA polymerase is only able to extend the primer by adding free nucleotides to the 3’ end.
One of the template strands is read in a 3’ to 5’ direction, therefore the new strand will be formed in a 5’ to 3’ direction. This newly formed strand is referred to as the leading strand. Along the leading strand, DNA primase only needs to synthesise an RNA primer once, at the beginning, to initiate DNA polymerase. This is because DNA polymerase is able to extend the new DNA strand by reading the template 3′ to 5′, synthesising in a 5′ to 3′ direction as noted above.
However, the other template strand (the lagging strand) is antiparallel and is therefore read in a 5’ to 3’ direction. Continuous DNA synthesis, as in the leading strand, would need to be in the 3′ to 5′ direction, which is impossible as DNA polymerase cannot add bases to the 5′ end. Instead, as the helix unwinds, RNA primers are added to the newly exposed bases on the lagging strand and DNA synthesis occurs in fragments, but still in the 5′ to 3′ direction as before. These fragments are known as Okazaki fragments.
Termination
The process of expanding the new DNA strands continues until there is either no more DNA template strand left to replicate (i.e. at the end of the chromosome) or two replication forks meet and subsequently terminate. The meeting of two replication forks is not regulated and happens randomly along the course of the chromosome.
Once DNA synthesis has finished, the newly synthesised strands are bound and stabilised. For the lagging strand, two enzymes are needed to achieve this stabilisation: RNAase H removes the RNA primer at the beginning of each Okazaki fragment, and DNA ligase joins these fragments together to create one complete strand.

Diagrammatic representation of DNA replication
Transcription and gene expression
Transcription is the process by which a segment of DNA is copied into RNA by the enzyme RNA polymerase. This RNA molecule, called messenger RNA (mRNA), carries the genetic information from the DNA to the ribosome, where it serves as a template for protein synthesis.
The process of transcription involves several steps:
- Initiation: RNA polymerase binds to a specific region of the DNA called the promoter. This signals the beginning of transcription, and the DNA strands unwind to allow the RNA polymerase to access the DNA template strand.
- Elongation: RNA polymerase adds complementary RNA nucleotides to the growing mRNA strand, using the DNA template strand as a guide. The mRNA is synthesized in the 5′ to 3′ direction, matching the sequence of the non-template DNA strand.
- Termination: Transcription ends when RNA polymerase reaches a specific termination sequence in the DNA. This causes the RNA polymerase to detach from the DNA template, and the newly synthesized mRNA is released.
After transcription, the mRNA molecule undergoes several modifications, including the addition of a 5′ cap and a poly-A tail, as well as the removal of introns (non-coding regions) through a process called splicing. The mature mRNA is then ready to be translated into a protein by the ribosome.
Gene expression refers to the process by which the information encoded in a gene is used to synthesize a functional gene product, such as a protein or RNA molecule. It involves transcription, followed by translation (in the case of protein-coding genes), and post-translational modifications.
Gene expression is tightly regulated and can be influenced by various factors, including environmental cues, cell signaling pathways, and the presence of specific regulatory proteins. Dysregulation of gene expression can lead to various diseases, including cancer and genetic disorders.
Gene structure and transcription
The DNA sequence contains the information to control all biological functions, including the manifestation of traits important to agriculture (yield, drought tolerance, disease resistance, etc., etc.) How is the information contained in DNA sequences converted into the cellular activities necessary for plants and other organisms to function? DNA sequences are used to direct the synthesis of other molecules that actually perform these cellular functions.
Most typical genes encode proteins. The production of a protein from a gene involves several different processes (Figure 1). Transcription involves the copying of the DNA nucleotide sequence into an intermediate nucleotide molecule called RNA (ribonucleic acid). The primary RNA molecule is processed into a mature messenger RNA (mRNA) which then provides the information for the synthesis of a protein through the process of translation. Proteins are composed of amino acids connected by peptide bonds. The sequence of amino acids is determined by the sequence of nucleotide bases in the mRNA. The 20 amino acids have different chemical and physical properties and the sequence of amino acids determine the structure and function of the protein.
Gene structure
Only particular regions of chromosomal DNA are transcribed. A gene can be considered as the region of transcribed DNA, along with associated regions of DNA important for the regulation of transcription (Figure 1). A gene has several parts that are each important to the function of the gene.
The regulatory region (also known as the promoter) contains DNA sequence involved in the control of where and when the genes will be turned on to produce mRNA. The coding region is the part of the gene that is used as template to produce RNA molecules in a process called transcription. Some RNA molecules perform cellular functions directly while many others (messenger RNAs) are used to direct the synthesis of proteins in a process called translation.
a. Gene Promoter
The signals for starting and stopping transcription are located within DNA sequences. Specific nucleotide segments called promoters are recognized by RNA polymerase to start RNA synthesis. After the transcription of full-length RNA strand is completed, a second segment of DNA called terminator invokes termination of RNA synthesis and the detachment of RNA polymerases from the DNA template.
b. Protein-coding region
The protein-coding region of a gene is composed of the sequence of nucleotides that codes for amino acids. As described further in the section on translation, the coding region begins with an ATG start codon (AUG in RNA) and then ends with one of three stop codons. These sequences include only exons, but not all exonic sequences are protein coding as they may include untranslated regions.
c. Untranslated regions (UTRs)
Mature transcripts contain some sequences that do not code for amino acid sequences in proteins. These are referred to as untranslated regions or UTRs. Most mRNA transcripts contain a 5′ and a 3′ UTR. The 5′ UTR contains sequences toward the 5′ end of the mRNA sequence, before the start codon. These sequences can often be important for translational regulation, and sometimes other functions. The sequences following the stop codon are the 3′ UTR. The 3′ UTR may also have important functions regulating transcript stability or directing transcript localization within cells, or sometimes even transport (trafficking) between cells.
UTRs and introns are often useful in genetic studies. Protein coding regions are under strong selective pressure to produce functional proteins and so sequence variation is relatively rare. UTRs and introns on the other hand are under less stringent selection and are therefore sources of sequence variants that can be used to develop genetic markers.
Transcription
The genetic information of DNA is transferred to an intermediate molecule called RNA that is often translated to amino acid sequences used to build proteins. RNA is a nucleic acid, like DNA, but with some important differences. RNA contains a ribose sugar group instead of the deoxyribose found in DNA. RNA molecules are single stranded, instead of being double stranded. RNA contains a uridine (U) base and does not contain a thymidine base. The other bases (A, C, G) are contained in both RNA and DNA. U has the property of base-pairing with A.
RNA synthesis is directed by a DNA template in a process called transcription. A protein complex containing the enzyme RNA polymerase synthesizes an RNA molecule by adding nucleosides to the 3′ end of a growing chain. The principle of base pairing is used again and each nucleotide base added is complementary to the corresponding base on the DNA template. Thus, the RNA is complementary in sequence to the template strand of DNA, which is also referred to as “antisense” or “negative” strand (Figure 4). The RNA is identical in sequence (except U replaces T) to the other strand, which is called the “sense” or “positive” strand. Because RNA molecules are produced by the process of transcription, they are often referred to as transcripts.
RNA processing
Coding (transcribed) region
This is the region that is transcribed by RNA polymerase, also known as the RNA coding region. As described below, it may include introns, sequences that are removed from the mature RNA molecule during RNA processing. The transcribed region is demarcated by promoter and terminator sequences.
Introns and exons
As mentioned, and described in detail below, introns are sequences that are removed from transcripts during RNA processing. Sequences that are retained in mature transcripts are called exons. The corresponding stretches of DNA are typically referred to with the same terms. Introns are commonly found in genes of eukaryotes but are rare in prokaryotic organisms.
Intron splicing
The process of transcription produces pre-mRNA that contains both introns and exons. The process of splicing involves removal of introns from pre-mRNA and joining together the exons. A complex group of proteins that form a spliceosome perform the splicing reaction.
Introns sometimes serve as boundaries for sequences encoding functional protein domains, leading to possibility for new and variant proteins by exon shuffling. Also, introns can provide possibility for productions of variant RNA forms through alternate splicing allowing more than one gene product from a single gene. Some introns result from the insertion of transposable elements and may be spliced perfectly of imperfectly, offering more possibility for new genetic diversity.
5′ Capping
The 5’ capping is the addition of a 7-methyl guanidine to the first nucleotide of mRNA molecule, usually and adenine or guanidine. The phosphodiester linkage between 7-methyl guanidine and the target nucleotide is 5′-5′ instead of 5′-3′, and 3 phosphates rather than 1 are retained in the linkage. The cap stabilizes the 5′ end of the mRNA and plays a role in translation initiation.
Poly adenylation
The transcription of a gene may proceed beyond what ends up as 3′ end of mature mRNA. Thus the 3′ end of mRNA is formed after transcription. The enzyme poly(A) polymerase adds numerous adenosines to the 3′ end to result in what is called the poly(A) tail. The poly(A) tail is necessary for proper processing and transport of mRNA to the cytoplasm. The poly(A) tail is also important for the stability of mRNA, and initiation of translation in eukaryotic organisms.
Translation and protein synthesis
Translation is the process by which a sequence of messenger RNA (mRNA) is decoded by a ribosome to produce a specific protein. It is the second step in gene expression, following transcription, which produces mRNA from a DNA template. Protein synthesis involves several key steps:
- Initiation: The small ribosomal subunit binds to the mRNA molecule at a specific sequence called the start codon (usually AUG). The initiator tRNA, carrying the amino acid methionine, also binds to the start codon.
- Elongation: The ribosome moves along the mRNA molecule, reading the codons (three-nucleotide sequences) and bringing in the appropriate tRNA molecules with complementary anticodons. Each tRNA molecule carries a specific amino acid that corresponds to the mRNA codon.
- Peptide Bond Formation: As the ribosome moves along the mRNA, it catalyzes the formation of peptide bonds between adjacent amino acids, creating a growing polypeptide chain.
- Translocation: After a new amino acid is added to the growing chain, the ribosome moves to the next codon along the mRNA, and the process continues.
- Termination: Translation ends when the ribosome reaches a stop codon (UAA, UAG, or UGA) on the mRNA. Release factors bind to the stop codon, causing the ribosome to release the completed polypeptide chain.
- Post-Translational Modifications: The newly synthesized polypeptide chain may undergo further modifications, such as folding into its final three-dimensional structure, adding chemical groups (e.g., phosphorylation), or cleavage to produce the final functional protein.
Protein synthesis is a highly regulated process that ensures the accurate production of proteins needed for cellular functions. Errors in translation can lead to the production of non-functional or harmful proteins and are associated with various diseases, including genetic disorders and cancer.
Cell cycle and cell division
The cell cycle is the series of events that take place in a cell leading to its division and duplication. It consists of several phases, including interphase (G1, S, and G2 phases) and mitotic phase (M phase), during which the cell grows, copies its DNA, and divides into two daughter cells. Here is an overview of the cell cycle phases:
- Interphase:
- G1 Phase (Gap 1): The cell grows and performs its normal functions.
- S Phase (Synthesis): DNA replication occurs, resulting in the duplication of the genetic material.
- G2 Phase (Gap 2): The cell continues to grow and prepares for cell division.
- Mitotic Phase (M Phase):
- Mitosis: The nucleus of the cell divides into two nuclei, each containing an identical copy of the genetic material.
- Prophase: Chromosomes condense, and the nuclear membrane breaks down.
- Metaphase: Chromosomes line up along the metaphase plate, and spindle fibers attach to the centromeres.
- Anaphase: Sister chromatids separate and move to opposite poles of the cell.
- Telophase: Chromosomes decondense, and nuclear membranes form around the two sets of chromosomes.
- Cytokinesis: The cytoplasm of the cell divides, forming two daughter cells.
- Mitosis: The nucleus of the cell divides into two nuclei, each containing an identical copy of the genetic material.
After cytokinesis, the two daughter cells enter the G1 phase of the cell cycle, and the process repeats.
Cell division is crucial for growth, development, and maintenance of multicellular organisms. It is tightly regulated by various checkpoints to ensure that each step occurs accurately and at the right time. Dysregulation of the cell cycle can lead to uncontrolled cell division, resulting in diseases such as cancer.

Exercise: Sequence analysis of DNA replication genes using bioinformatics tools.
To perform sequence analysis of DNA replication genes using bioinformatics tools, you can follow these general steps:
- Obtain DNA Sequences:
- Sequence Alignment:
- Use a sequence alignment tool such as BLAST (Basic Local Alignment Search Tool) to align the DNA sequences against a reference sequence or other similar sequences.
- Identify conserved regions and potential functional domains within the sequences.
- Phylogenetic Analysis:
- Perform a phylogenetic analysis to study the evolutionary relationships between the DNA replication genes across different species.
- Construct a phylogenetic tree using tools like MEGA (Molecular Evolutionary Genetics Analysis) or PHYLIP.
- Motif and Domain Analysis:
- Use tools like MEME (Multiple Em for Motif Elicitation) or InterProScan to identify conserved motifs and protein domains within the DNA replication genes.
- Determine if any known functional domains or motifs are present in the sequences.
- Functional Annotation:
- Annotate the DNA replication genes with functional information obtained from databases such as UniProt or Pfam.
- Identify any known functional annotations or pathways associated with these genes.
- Structural Analysis:
- Use tools like SWISS-MODEL or Phyre2 to predict the 3D structure of the DNA replication proteins based on their amino acid sequences.
- Analyze the predicted structures for functional insights and potential drug targets.
- Data Visualization:
- Interpretation and Conclusion:
- Analyze the results of the sequence analysis to draw conclusions about the evolutionary conservation, functional domains, and structural features of the DNA replication genes.
- Discuss the implications of these findings in the context of DNA replication and cellular biology.
By following these steps, you can perform a comprehensive sequence analysis of DNA replication genes using bioinformatics tools, gaining insights into their evolutionary history, functional characteristics, and structural properties.
Cell Signaling
Types of cell signaling
Cell signaling is the process by which cells communicate with each other to regulate various physiological processes. There are several types of cell signaling, including:
- Endocrine Signaling: In endocrine signaling, specialized endocrine cells release hormones into the bloodstream. These hormones travel to target cells in distant parts of the body, where they bind to specific receptors on the target cells, triggering a response. Examples of hormones include insulin, estrogen, and adrenaline.
- Paracrine Signaling: Paracrine signaling involves the release of signaling molecules (such as growth factors, cytokines, and neurotransmitters) by one cell, which then act on neighboring cells. Unlike endocrine signaling, paracrine signaling affects only nearby cells and does not involve the bloodstream.
- Autocrine Signaling: Autocrine signaling occurs when a cell releases signaling molecules that bind to receptors on its own cell surface, leading to a response within the same cell. This type of signaling is important in regulating cell growth, differentiation, and immune responses.
- Direct Signaling: Direct signaling involves physical contact between adjacent cells through specialized protein structures called gap junctions or through cell surface molecules. This type of signaling allows for the direct transfer of signaling molecules or ions between cells.
- Neuronal Signaling: Neuronal signaling involves the transmission of signals between neurons through electrical impulses and chemical neurotransmitters. This type of signaling is important for the coordination of activities in the nervous system, including sensory perception, motor control, and cognition.
- Juxtacrine Signaling: Juxtacrine signaling occurs when a cell directly stimulates receptors on an adjacent cell through cell-cell contact. This type of signaling is important in processes such as cell development, immune responses, and tissue repair.
These types of cell signaling work together to regulate various physiological processes in multicellular organisms, ensuring that cells can respond appropriately to internal and external signals to maintain homeostasis.
Signal transduction pathways
Signal transduction pathways are mechanisms by which cells convert extracellular signals into intracellular responses. These pathways are crucial for cell communication and enable cells to respond to their environment. Here is an overview of the main components and steps involved in signal transduction pathways:
- Reception: The process begins when a signaling molecule, such as a hormone or growth factor, binds to a specific receptor protein on the cell surface or inside the cell. This binding event causes a conformational change in the receptor, activating it.
- Transduction: The activated receptor then initiates a series of signaling events within the cell, known as signal transduction. This typically involves the activation of intracellular signaling molecules, such as enzymes or second messengers, which relay the signal to downstream targets.
- Amplification: In many signal transduction pathways, the initial signal is amplified through a series of enzymatic reactions. This amplification step ensures that the cell can generate a robust response to a weak extracellular signal.
- Integration: Cells often receive multiple signals simultaneously, which must be integrated to produce a coordinated response. Signal integration can occur at various points in the pathway, allowing for complex cellular responses to different combinations of signals.
- Propagation: The signal is propagated through the cell, often involving the activation of additional signaling molecules and the modification of cellular proteins. This leads to changes in cell behavior, such as gene expression, cell growth, or cell death.
- Response: The signal transduction pathway ultimately leads to a specific cellular response, such as changes in gene expression, alterations in cell metabolism, or changes in cell shape and motility. These responses enable the cell to adapt to changes in its environment and maintain homeostasis.
Signal transduction pathways are highly regulated processes, with various feedback mechanisms and checkpoints to ensure that the cellular response is appropriate and controlled. Dysregulation of these pathways can lead to diseases such as cancer, autoimmune disorders, and metabolic disorders.
Role of signaling in cellular function
Cell signaling plays a crucial role in regulating various cellular functions, ensuring that cells can respond appropriately to internal and external cues. Here are some key roles of signaling in cellular function:
- Cell Growth and Division: Signaling pathways regulate cell growth and division by controlling the expression of genes involved in cell cycle progression. This ensures that cells only divide when necessary and that the process is tightly regulated.
- Differentiation: Signaling pathways play a role in cell differentiation, where cells become specialized for specific functions. This is crucial for the development of multicellular organisms and the formation of tissues and organs.
- Cell Survival and Apoptosis: Signaling pathways regulate cell survival and apoptosis (programmed cell death) by controlling the expression of genes involved in cell survival and apoptosis. This helps maintain the balance between cell proliferation and cell death.
- Metabolism: Signaling pathways regulate metabolism by controlling the expression of genes involved in energy production, nutrient uptake, and storage. This ensures that cells can respond to changes in nutrient availability and energy demands.
- Immune Response: Signaling pathways play a role in the immune response by regulating the activation of immune cells and the production of inflammatory mediators. This helps the body defend against pathogens and maintain immune homeostasis.
- Cell Communication: Signaling pathways allow cells to communicate with each other, coordinating their activities in tissues and organs. This is essential for processes such as cell migration, tissue repair, and synaptic transmission in the nervous system.
- Stress Response: Signaling pathways mediate the cellular response to stress, such as oxidative stress, heat shock, or DNA damage. This helps cells adapt to environmental challenges and maintain cellular homeostasis.
Overall, signaling pathways are essential for the proper functioning of cells and organisms, coordinating various cellular processes to ensure survival, growth, and adaptation to changing environments. Dysregulation of signaling pathways can lead to various diseases, including cancer, autoimmune disorders, and metabolic disorders.
Exercise: Analyzing a signaling pathway using bioinformatics databases and tools.
To analyze a signaling pathway using bioinformatics databases and tools, you can follow these general steps:
- Identify the Signaling Pathway of Interest: Choose a specific signaling pathway you want to analyze. For example, the MAPK signaling pathway, which is involved in cell proliferation, differentiation, and apoptosis.
- Collect Information about the Pathway: Use bioinformatics databases such as KEGG (Kyoto Encyclopedia of Genes and Genomes) or Reactome to gather information about the components of the pathway, including proteins, genes, and interactions.
- Visualize the Pathway: Use bioinformatics tools such as Cytoscape or PathVisio to visualize the pathway and its components. This can help you understand the structure of the pathway and the interactions between its components.
- Analyze Gene Expression Data: Use tools such as GEO (Gene Expression Omnibus) or TCGA (The Cancer Genome Atlas) to analyze gene expression data related to the pathway. This can help you identify genes that are differentially expressed in certain conditions or diseases.
- Identify Genetic Variants: Use databases such as dbSNP or ClinVar to identify genetic variants (e.g., SNPs) in genes associated with the pathway. This can help you understand how genetic variation may impact pathway function.
- Functional Enrichment Analysis: Use tools such as DAVID (Database for Annotation, Visualization, and Integrated Discovery) or Enrichr to perform functional enrichment analysis on the genes associated with the pathway. This can help you identify biological processes, pathways, and diseases that are enriched in your gene list.
- Network Analysis: Use network analysis tools to analyze the interactions between genes in the pathway. This can help you identify key nodes (genes) in the network that may be important for pathway function.
- Integration and Interpretation: Finally, integrate and interpret the results of your analysis to gain insights into the functioning of the signaling pathway in the context of your research question or hypothesis.
By following these steps, you can analyze a signaling pathway using bioinformatics databases and tools, gaining insights into its structure, function, and regulation.
Bioinformatics Applications
Introduction to bioinformatics databases (e.g., NCBI, UniProt)
Bioinformatics databases are repositories of biological data that are organized, searchable, and accessible to researchers. These databases store a wide range of biological information, including DNA sequences, protein sequences, protein structures, gene expression data, and more. They play a crucial role in biological research by providing access to vast amounts of data that can be used to study and analyze various biological processes.
Some of the most widely used bioinformatics databases include:
- NCBI (National Center for Biotechnology Information): NCBI hosts a variety of databases, including GenBank (a database of DNA sequences), PubMed (a database of scientific literature), and BLAST (a tool for comparing DNA or protein sequences against a database to identify similarities).
- UniProt: UniProt is a comprehensive resource for protein sequence and annotation data. It provides access to protein sequences, functional information, and annotations from a variety of sources.
- Ensembl: Ensembl is a genome browser and database that provides access to genome sequences and annotations for a wide range of organisms. It allows researchers to explore and analyze genomic data in a user-friendly interface.
- PDB (Protein Data Bank): PDB is a database of 3D structural data for proteins and other biological macromolecules. It provides access to experimentally determined protein structures, which can be used for structure-based drug design and other studies.
- KEGG (Kyoto Encyclopedia of Genes and Genomes): KEGG is a database that integrates genomic, chemical, and systemic functional information. It provides pathways, networks, and functional annotations for a wide range of organisms.
- STRING: STRING is a database of known and predicted protein-protein interactions. It provides a comprehensive view of protein interaction networks, which can be used to study the functional relationships between proteins.
These databases are invaluable resources for biological research, providing researchers with access to a wealth of data that can be used to study biological processes, analyze experimental results, and generate hypotheses for further study.
Basic sequence analysis techniques
Sequence analysis is a fundamental task in bioinformatics that involves the analysis of biological sequences, such as DNA, RNA, and protein sequences. Here are some basic sequence analysis techniques:
- Sequence Alignment: Sequence alignment is the process of arranging two or more sequences to identify similarities and differences. There are two main types of sequence alignment: pairwise alignment (aligning two sequences) and multiple sequence alignment (aligning three or more sequences).
- Homology Search: Homology search is used to identify similar sequences in a database. The most commonly used tool for homology search is Basic Local Alignment Search Tool (BLAST), which compares a query sequence to a database of known sequences to find similar sequences.
- Sequence Motif Analysis: Sequence motifs are short, conserved patterns in biological sequences that are important for their function. Motif analysis involves identifying and characterizing these motifs using tools such as MEME Suite and PROSITE.
- Sequence Annotation: Sequence annotation involves identifying the functional elements in a sequence, such as genes, regulatory regions, and protein domains. Tools like NCBI’s Prokaryotic Genome Annotation Pipeline (PGAP) and InterProScan can be used for sequence annotation.
- Phylogenetic Analysis: Phylogenetic analysis is used to study the evolutionary relationships between different biological sequences. This is done by constructing phylogenetic trees that depict the evolutionary history of the sequences.
- Secondary Structure Prediction: Secondary structure prediction is used to predict the secondary structure elements (alpha helices, beta sheets, and turns) in a protein sequence. Tools like PSIPRED and JPred can be used for secondary structure prediction.
- Protein Structure Prediction: Protein structure prediction is used to predict the three-dimensional structure of a protein sequence. This can be done using homology modeling, ab initio modeling, and threading methods.
These are just a few basic sequence analysis techniques used in bioinformatics. There are many other advanced techniques and tools available for analyzing biological sequences, depending on the specific research question and type of data being analyzed.
Gene expression analysis using bioinformatics tools
Gene expression analysis using bioinformatics tools involves studying the patterns of gene expression in cells or tissues based on high-throughput sequencing data. Here are some common steps and tools used in gene expression analysis:
- RNA Sequencing (RNA-Seq): RNA-Seq is a technique used to quantify gene expression levels by sequencing the RNA molecules present in a sample. It provides a comprehensive view of the transcriptome and can be used to identify differentially expressed genes between conditions.
- Data Preprocessing: Before analysis, RNA-Seq data is preprocessed to remove low-quality reads, filter out rRNA, and align reads to a reference genome or transcriptome using tools like HISAT2, STAR, or Tophat.
- Quantification of Gene Expression: Tools like featureCounts, HTSeq, or Salmon are used to quantify gene expression levels by counting the number of reads that map to each gene.
- Differential Expression Analysis: Differential expression analysis compares gene expression levels between different conditions (e.g., diseased vs. healthy) to identify genes that are significantly up- or down-regulated. Tools like DESeq2, edgeR, and limma are commonly used for this analysis.
- Gene Set Enrichment Analysis (GSEA): GSEA is used to identify whether a predefined set of genes shows statistically significant differences in expression between two biological states. Tools like GSEA and clusterProfiler are used for this analysis.
- Visualization: Visualization tools like heatmaps, volcano plots, and gene expression plots are used to visualize the results of differential expression analysis and identify patterns in gene expression data.
- Functional Annotation: Functional annotation tools like DAVID, Enrichr, and Metascape are used to annotate differentially expressed genes and identify enriched biological pathways, gene ontology terms, and functional annotations.
- Validation: Experimental validation of gene expression results can be done using techniques like qRT-PCR or western blotting to confirm the findings from bioinformatics analysis.
Gene expression analysis using bioinformatics tools provides valuable insights into the molecular mechanisms underlying biological processes and diseases, and it is widely used in research and clinical settings.
Introduction to systems biology and network analysis
Systems biology is an interdisciplinary field that aims to understand biological systems as a whole by studying the interactions and relationships between their components. It integrates experimental data, computational modeling, and theoretical analysis to gain insights into the complex behavior of biological systems. Network analysis is a key approach used in systems biology to study the structure and function of biological networks, such as protein-protein interaction networks, gene regulatory networks, and metabolic networks. Here’s an overview of systems biology and network analysis:
- Systems Biology:
- Systems biology takes a holistic approach to studying biological systems, considering the interactions between genes, proteins, metabolites, and other molecules.
- It focuses on understanding how biological systems function as integrated networks, rather than studying individual components in isolation.
- Systems biology uses a combination of experimental techniques, such as high-throughput omics technologies (genomics, transcriptomics, proteomics, metabolomics), and computational modeling to study complex biological systems.
- Network Analysis:
- Network analysis is a method used in systems biology to study the structure and dynamics of biological networks.
- Biological networks are represented as graphs, with nodes representing biological entities (e.g., genes, proteins) and edges representing interactions between them (e.g., physical interactions, regulatory relationships).
- Network analysis techniques are used to identify important network components (e.g., hubs, clusters) and analyze network properties (e.g., modularity, robustness).
- Applications of Systems Biology and Network Analysis:
- Systems biology and network analysis are used to study various biological processes, such as cell signaling, gene regulation, metabolic pathways, and disease mechanisms.
- They can help identify key regulatory mechanisms, biomarkers for disease diagnosis and prognosis, and potential drug targets.
- Network analysis can also be applied to other complex systems, such as social networks, to study their structure and dynamics.
- Tools and Resources:
- There are several bioinformatics tools and databases available for systems biology and network analysis, such as Cytoscape, STRING, and BioGRID, which allow researchers to visualize, analyze, and integrate biological network data.
In summary, systems biology and network analysis provide a powerful framework for studying the complexity of biological systems, offering insights into their structure, function, and behavior. These approaches have the potential to revolutionize our understanding of biology and medicine, leading to new insights and discoveries.
Exercise: Analyzing gene expression data from a microarray experiment using R or Python.
Analyzing gene expression data from a microarray experiment typically involves several steps, including data preprocessing, normalization, differential expression analysis, and visualization. Here’s a basic example of how to analyze gene expression data using R:
- Data Loading: First, you need to load the gene expression data into R. Here, we assume the data is stored in a tab-delimited text file, with rows representing genes and columns representing samples.
# Load gene expression data
 data <- read.delim("gene_expression_data.txt", header = TRUE, row.names = 1)
- Data Preprocessing: Perform any necessary data preprocessing steps, such as filtering out low-expression genes or correcting for background noise.
- Normalization: Normalize the gene expression data to account for differences in signal intensity between samples. Here, we use the
normalizeBetweenArraysfunction from thelimmapackage for normalization.
library(limma)# Normalize gene expression data
 normalized_data <- normalizeBetweenArrays(data, method = "quantile")
- Differential Expression Analysis: Perform differential expression analysis to identify genes that are significantly differentially expressed between groups. Here, we use the
lmFitandeBayesfunctions from thelimmapackage for linear modeling and empirical Bayes moderation of the standard errors.
# Define experimental groups (e.g., control vs. treatment)
 group <- factor(c("control", "treatment", "control", "treatment"))# Perform differential expression analysis
 design <- model.matrix(~group)
 fit <- lmFit(normalized_data, design)
 fit <- eBayes(fit)
- Results Visualization: Visualize the results of the differential expression analysis, such as volcano plots or heatmaps, to identify significantly differentially expressed genes.
# Volcano plot
 volcano <- plotMA(fit, ylim = c(-2, 2), p.value = 0.05, col = c("blue", "red"))# Heatmap
 heatmap <- heatmap.2(exprs(fit), scale = "row", trace = "none")
This is a basic example of how to analyze gene expression data from a microarray experiment using R. Depending on your specific research question and data, you may need to perform additional analyses or use different methods and packages.
Final Project:
Design a bioinformatics workflow to analyze a specific cellular process (e.g., cell cycle regulation) using publicly available data and tools.
Here’s a bioinformatics workflow to analyze cell cycle regulation using publicly available data and tools:
- Data Retrieval: Download gene expression data related to the cell cycle from a public repository such as Gene Expression Omnibus (GEO) or The Cancer Genome Atlas (TCGA). For this example, we will use a dataset from GEO (GSE9533) that contains gene expression data from cell cycle synchronized HeLa cells.
- Data Preprocessing: Preprocess the gene expression data to remove noise and normalize the data. You can use tools like R or Python for this step. Here, we will use R and the
limmapackage for normalization. - Differential Expression Analysis: Perform differential expression analysis to identify genes that are differentially expressed during different phases of the cell cycle. Use tools like the
limmapackage in R to compare gene expression between different phases of the cell cycle (G1, S, G2, M). - Functional Enrichment Analysis: Perform functional enrichment analysis to identify biological processes, molecular functions, and cellular components that are enriched among the differentially expressed genes. Use tools like DAVID or Enrichr for this analysis.
- Pathway Analysis: Perform pathway analysis to identify signaling pathways and regulatory networks involved in cell cycle regulation. Use tools like Reactome or KEGG pathway databases for this analysis.
- Network Analysis: Construct gene regulatory networks or protein-protein interaction networks to identify key regulators and interactions involved in cell cycle regulation. Use tools like Cytoscape for network visualization and analysis.
- Validation: Validate the results of your analysis using experimental data or literature evidence. Check if the identified genes, pathways, and networks are consistent with known mechanisms of cell cycle regulation.
- Integration and Visualization: Integrate the results of your analysis and visualize them using plots, heatmaps, or network diagrams. Summarize your findings and draw conclusions about the role of specific genes and pathways in cell cycle regulation.
This workflow provides a basic framework for analyzing cell cycle regulation using publicly available data and tools. Depending on your specific research question and data, you may need to customize the workflow and use additional tools or databases.
By integrating cell biology with bioinformatics, students will develop a strong foundation in both disciplines, preparing them for advanced studies or careers in areas such as genomics, proteomics, and systems biology.
Related posts:
![Docker-bioinformatics]()
Docker for Bioinformatics Analysis
bioinformatics![linuxbioinformatics]()
Installing Bioinformatics Software in Linux
bioinformatics![Artificial_Intelligence__AI__Machine_Learning_-_Deeplearning]()
How Machine Learning is Transforming Bioinformatics
A.I![Algorithms-in-Computational-Biology-1-1024x576]()
Step-by-Step Guide to Writing an Algorithm for Bioinformatics
bioinformatics![Sequence Alignment Made Simple: A Guide to the Top Open Source Tools]()
Sequence Alignment Made Simple: A Guide to the Top Open Source Tools
Guides![Understanding PSI-BLAST: A Comprehensive Guide]()
Understanding PSI-BLAST: A Comprehensive Guide
bioinformatics![Protein structure and AI]()
Revolutionizing Drug Discovery: Unveiling the Power of AI-Based Protein Structure Prediction Methods
A.I![microarray analysis]()
Step-by-Step Guide: Converting Affymetrix Probes to Gene IDs Using R and BioConductor
bioinformatics![bioinformatics-statistics]()
Creating a Volcano Plot from DESeq2 Analysis
bioinformatics![R for Biologists An Introductory Guide to Bioinformatics Analysi]()
R for Biologists: An Introductory Guide to Bioinformatics Analysis
bioinformatics![Converting DNA to Protein Sequence]()
Converting DNA to Protein Sequence
bioinformatics![AI-proteomics-transcriptomics-bioinformatics]()
Step-by-Step Guide for Converting FASTQ to FASTA Files
bioinformatics![datascience]()
Data Science and Big Data in Drug Discovery
bioinformatics![remotecomputer-bioinformatics]()
Step-By-Step Docker Installation on Windows and Linux
bioinformatics![android-app-bioinformatics]()
Basics of Android App Development for Bioinformatics
bioinformatics![Aicoursesinindia]()
Top 12 AI Tools Revolutionizing Bioinformatics Research in 2025: Must-Have ChatGPT-Like Platforms
A.I